This commentary is written by Martin Fridson, a high-yield market veteran who is chief investment officer of Lehmann Livian Fridson Advisors LLC, as well as a contributing analyst to S&P Global Market Intelligence.
 |
In a June 24 commentary, “Why high yield investors should welcome fallen angels” we wrote, “Historical returns indicate that over the longer term the greatly feared influx of BBB downgrades will raise the high-yield market's total return while also improving its credit quality.”
It did not take long to obtain some corroboration of that thesis.
For June, the ICE BofA US Fallen Angel High Yield Index pulled up the all-high yield return substantially, scoring an attention-grabbing total return of 3.35%. With a 15.47% share of the ICE BofA US High Yield Index’s market value on May 31, 2020, fallen angels enabled the ICE BofA US High Yield Index to achieve a 0.98% total return. Without their contribution, the all-HY return would have equaled the much lower 0.54% produced by the ICE BofA US Original Issue High Yield Index. (If you replicate our weighted-return calculation, you will find a 0.0053-percentage-point discrepancy attributable to rounding.)
Statements of this sort invite questions about lurking variables. Such questions are particularly apropos for this monthly piece. We regularly devote much of our analysis of monthly returns to uncovering lurking variables that may distort high-yield performance attribution.
Fallen angels' June boost to the overall high-yield return was not BB superiority in disguise. The ICE BofA US High Yield Fallen Angels Index’s May 31, 2020, average Composite Rating was smack in the middle of that rating tier, at BB2. With fallen angels' June total return at 3.35% versus just 1.03% for the ICE BofA BB US High Yield Index, it was the fallen angels that pulled up the BBs, rather than the reverse.
Another plausible conjecture is that fallen angels surpassed the all-HY return by virtue of their comparatively long average maturities. Investment-grade companies can issue bonds dated 30 years or longer. Those that fall to speculative-grade often have outstanding issues with remaining maturities considerably longer than the standard 10-year maximum initial maturity of original issue high-yield bonds. As detailed below, the 15+ year basket was June's best-performing maturity-based sector, with a 5.50% total return. It is therefore not delusional to surmise that fallen angels beat original issues merely because they are longer-dated on average.
Close inspection of the underlying data rejects that hypothesis, however. True, the fallen angel index's average maturity on May 31 was nearly twice as long as the original issue index's (10.24 years versus 5.50 years) and many of its constituents had maturities greater than 15 years. The 15+ year basket's average maturity, however, was more than twice again as long, at 23.23 years. That fact alone limited the total return boost that fallen angels might have gained by overlapping with the longest and best-performing high-yield maturity basket.
Furthermore, the fallen angel index's May 31 effective duration was just 56% as great as the 15+ year maturity basket's (6.29 years versus 11.23 years). The price gain fallen angels recorded in June, +2.93%, was 59% as great as the 15+ year maturity basket's price gain of +4.99%. These figures undercut any suggestion that fallen angels got some sort of free ride from the high-yield market's longest-dated maturities. That conclusion is buttressed by the fact that the 10-to-15-year basket had an effective duration 1.29x as long as the fallen angels index's (8.12 versus 6.29), yet achieved a June price gain only 0.43x as great (1.25% versus 2.93%). In short, long duration did not guarantee large price gains in June. Fallen angels generated their superior returns the old-fashioned way, through reduced risk premiums.
To be sure, some of that reduction in risk premiums resulted from a higher May 31 market-value-based concentration in Energy than the all-HY index (27.48% versus 12.48%). That large weighting was attributable in no small measure to Occidental Petroleum Corp.'s downgrade earlier this year. Excluding Energy, though, fallen angels returned 2.68% in June, which still far outpaced the ICE BofA US High Yield Index's 0.98%.
In conclusion, no lurking variable explains away fallen angels' short-run validation of our contention that they are a benefit to high-yield returns, rather than the potential performance wrecker they have repeatedly been portrayed as during the past few years. If many more investment-grade bonds descend to speculative-grade before the current recession ends, some temporary indigestion may constrain speculative-grade returns. As an intermediate-to-longer-term proposition, though, investors in the high-yield asset class should be delighted to see BBBs coming their way.
Longest bonds topped high-yield returns, helped by Energy
June's differences in returns among high-yield maturity baskets were not driven by movement in underlying Treasury yields. Treasury rates on four of the six maturities displayed in the table below ended the month right where they began, to the basis point, after rising in the early part of June. The other maturities' month-over-month yield changes were minor. Accordingly, the total return extremes in high-yield, from –0.01% on the 7-to-10-year basket to 5.50% on the 15+ year basket, reflected pronounced changes in risk premiums, rather than a change in the shape of the yield curve. For example, the 7-to-10-year high-yield basket's option-adjusted spread, or OAS, widened by 13 bps, while the 15+ year basket’s tightened by 45 bps.
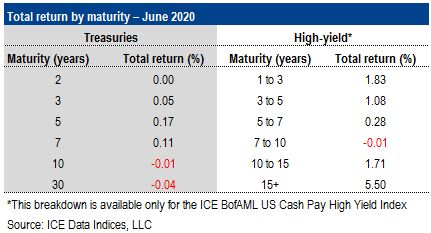 |
The 15+ year basket's 5.50% total return benefited from an outsized concentration in Energy, the month's second-highest-return major industry. (See details in industry total return rankings table below.) On May 31, Energy represented 26.73% of the longest-maturity segment's market value, more than double the 12.48% figure for the ICE BofA US High Yield Index as a whole. In particular, the 15+ year basket contained 12 issues of recent fallen angel Occidental Petroleum that delivered total returns ranging from 15.19% to 25.53%. Those sensational Energy returns were partially offset by returns of –9.91% to –24.89% on bonds of distressed issuer Valaris PLC. Still, Energy added 2 percentage points to the 15+ year issues' June return; the maturity basket excluding Energy returned “only” 3.48%.
Lowest-quality issues led the rally, again
CCC & Lower issues produced the highest total among the rating categories in June, repeating their league-leading performance in May. (See table below.) Distressed issues, which overlap extensively with the CCC & Lower, did even better, with a 5.69% total return. CCC & Lower bonds' two consecutive months at the top of the table did not, however, fully make up for their earlier-in-the-year underperformance. The CCC & Lower year-to-date total return of -14.86% lags the BB and B figures.
 |
It was not surprising that in a risk-off month, the lowest-rated issues outperformed the highest-rated ones. Fitting less neatly into the risk-versus-reward paradigm was the B category’s worst-in-show performance. The medium-quality subsector of speculative-grade posted a –0.43% price change and a barely positive 0.11% total return. Contributing to Bs’ out-of-order return was a large representation of distressed and nearly distressed Energy issues that went south, even as many of their industry fellows propelled the ICE BofA US High Yield Energy Index to second place in June’s ranking of major industries by total return.
Energy and Automotive tops, again
June's top two performers among major industries were the same two that occupied those positions in May. The only difference was a role reversal. Energy dropped from first to second while Automotive & Auto Parts rose from second to first. As in May, Energy benefited from a rise in crude oil prices, as the Generic 1st Crude Oil, West Texas Intermediate contract climbed from $35.49 to $39.27.
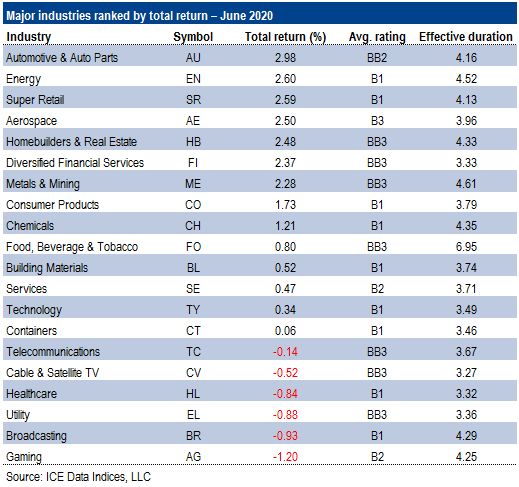 |
Two dramatic reversals in fortune highlighted June's industry returns. Gaming, which ranked third in May, dropped all the way to the bottom at No. 20. May's last-place finisher, Aerospace, soared to fourth. Gaming's fall from grace was not attributable to a few outliers, as bonds of 15 different issuers recorded negative returns for the month. Having said that, the casino issues did not all move in tandem. Four distressed Gaming bonds racked up returns in the range of 16% to 45%.
Also noteworthy in June’s industry rankings were the close-to-the-bottom placements of the Broadcasting and Utility industries, at No. 19 and No. 18, respectively. As previously reported, those were the only major industries with net positive ratings prospects in May. It was not just a matter of relatively safe industries failing to keep pace with the riskiest industries' gains. Broadcasting and Utility generated negative returns in June, making them two of just six industries that did so in the month.
No bonds hit the trifecta in June
Somewhat unusually, the latest month offered no vehicle for a short-horizon trader who correctly predicted the top-performing maturity (15+ years), rating (CCC & Lower), and industry (Automotive & Auto Parts). There were several CCC issuers in the industry sub-index, but none as long-dated as 15 years. Anyone shooting for the trifecta is consequently obliged to try again in July.
Utility only industry with positive ratings prospects
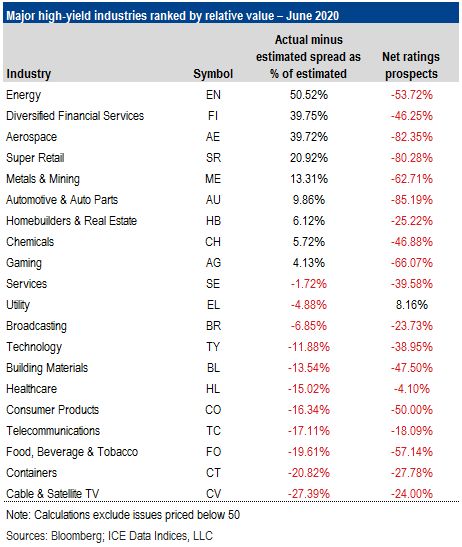
The Utility industry is now the only major industry with net positive ratings prospects, as indicated by its location to the right of zero in the chart below. Broadcasting, which was also to the right of zero in May, has moved to negative net ratings prospects territory, left of zero. Note, however, that according to our analysis, the market has correctly adjusted for Broadcasting's reduced ratings prospects, as shown by the industry's location very nearly on the graph's downward-sloping diagonal. (Broadcasting would lie exactly on that line if its vertical-axis coordinate were –7.49%; the actual figure is very close, at –6.85%.) In short, the market currently prices Broadcasting a bit expensively, versus its industry peers, on a rating-for-rating basis, to reflect the rating agencies' indications that, on balance, the industry's ratings are likely to decline.
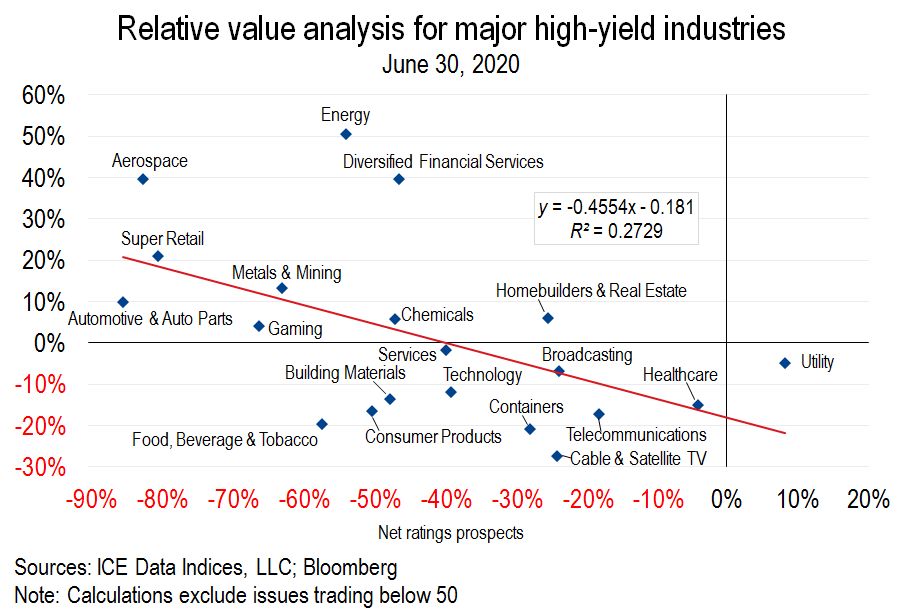 |
No industry is currently in the most attractive quadrant, the northeast, where an industry is located if it is priced cheap to its ratings despite rating agency indications that its ratings are likely to rise. On the other hand, fully half of the 20 industries covered by this analysis are in the southwest quadrant, the least attractive one. Among the southwesterners are such classically defensive industries as Cable & Satellite TV; Consumer Products; and Food, Beverage & Tobacco. Investors are willing to accept low rating-for-rating spreads on these industries, even though their ratings are likely to decline, according to the rating agencies.
Worth noting, as well, is the fact that Aerospace's net ratings prospects worsened from –23.53% in May, to –82.35% in June. The market ignored that credit-outlook deterioration, as gauged by the rating agencies, bestowing June's No. 4 total return ranking to Aerospace. Just ahead of Aerospace, at No. 3, was Super Retail (department stores, discounters, and specialty retailers), which deteriorated in its net ratings prospects from –35.14% in May, to –80.28% in June. In short, investors were willing to grab for yield in industries with poor ratings prospects even if those ratings prospects were rapidly becoming much worse.
These conclusions are based on the methodology introduced in “New industry analysis shows defensives too tight” (LCD News, June 5, 2013). See the table below for each industry's coordinates. According to our analysis, industries located above (below) the diagonal regression line in the preceding chart are cheap (expensive) versus their peers, taking into account both their spreads, adjusted for ratings mix, and positive or negative biases in their ratings outlooks and watchlistings.
 |
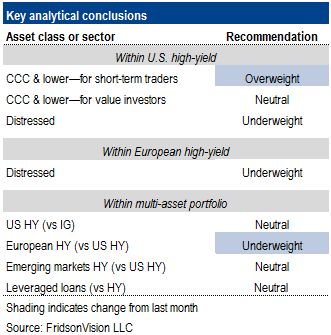
Short-term traders should Overweight CCC & Lower
Short-term traders should overweight CCC & Lower issues in July. Our recommendation is based on analysis presented in “When to over- or under-weight CCC & Lower issues” (LCD News, March 14, 2017). In June, the ICE BofAML CCC & Lower US High Yield Index outperformed the ICE BofAML BB-B US High Yield Index for the second consecutive time after a period (January to April) of producing an inferior return. Our analysis has found that under such conditions the odds strongly favor CCC & Lower issues outperforming in the following month.
As always, we caution that this methodology is expected to deliver an edge over time, rather than a win every single time that a non-Neutral recommendation is generated. Additionally, at any particular time the appropriate strategy for long-term, value-oriented investors may differ from the recommendation produced by this shorter-term and momentum-based approach (see section immediately below).
Value investors should remain Neutral on CCC & Lower issues
We are maintaining our Neutral recommendation on the CCC & Lower sector for patient, value-oriented investors. As documented in “CCC & Lower relatively cheap in rich HY market” (LCD News, April 23, 2019), variance in the ICE BAML CCC & Lower US High Yield Index's OAS is mostly a function of the ICE BofAML BB-B US High Yield Index's OAS. We calculate fair value for the CCC & Lower segment using this regression formula, with spreads denominated in basis points:
2.34 x BB+B OAS + 73.44 = Fair value of CCC & Lower
Despite June’s 10-bps tightening in the ICE BofA US High Yield Index’s OAS to +644 bps, from +654 bps in May, the BB+B OAS was nearly unchanged at +541 bps, up from +540 bps one month earlier. That is, the overall index's spread reduction was concentrated entirely in the CCC & Lower sector, which tightened by 94 bps, to +1,420 bps on June 30, versus +1,514 bps one month earlier.
Plugging the May 31 BB+B OAS into our formula produces a fair value of +1,388 bps for the CCC & Lower index. The actual CCC & Lower OAS exceeds that figure by just 32 bps. Based on our methodology we recommend overweighting the CCC & Lower sector when it is at least one standard deviation (254 bps) wider than the fair value estimate. Because the present CCC & Lower spread does not satisfy that requirement, we continue to recommend a neutral weighting for the bottom-tier rating category.
U.S. distressed should remain Underweighted
As detailed in “How to tell when distressed bonds are attractive” (LCD News, Nov. 28, 2012), the U.S. distress ratio, defined as the percentage of issues in the ICE BofAML US High Yield Index that are quoted at distressed levels (OAS of 1,000 bps or more), can be used to derive the market's implicit forecast of the speculative-grade default rate. The distressed default rate — conceptually, the percentage of distressed issuers that default within one year — declines as the distress ratio increases. Multiplying the distress ratio by the distressed default rate gives us the market's expected 12-month default rate.
On June 30, the distress ratio was just 17.61%, down from 26.12% one month earlier. The latest ratio is not far above the 1997–2019 monthly mean of 13.82%. Using the updated methodology described in “Estimating the market-implied default rate” (LCD News, Sept. 8, 2015), we calculate an expected distressed default rate of 30.2%, indicating that the market is priced for a default rate of 5.3% over the next 12 months. That compares with an implied Moody's forecast of 9.4%. (We derive this estimate by multiplying Moody’s U.S. bonds-plus-loans forecast of 11.6% by the 0.81 ratio of the agency's global bonds-only and global bonds-plus-loans forecasts.)
At a gap of 1 percentage point or more we conclude, based on historical analysis, that the distressed sector is likely to produce below-average returns over the coming 12 months. The present disparity of 4.1 percentage points is more like a chasm than a gap. Accordingly, we continue from last month our Underweight recommendation for distressed debt within a high-yield portfolio.
Neutral weighting still recommended for HY versus IG
We are maintaining our Neutral recommendation on high-yield in a portfolio that also contains investment-grade corporates.
In June, the option-adjusted spread on the ICE BofA US High Yield Index tightened by 10 bps, while the investment-grade ICE BofA US Corporate Index’s OAS tightened by 27 bps. The difference in spreads consequently increased to +484 bps, from May’s +467 bps. That left the two indexes' spread differential well above the threshold of +265 bps, below which we recommend underweighting high-yield. This conclusion is derived from the methodology introduced in “High-yield vs. investment-grade workout periods” (LCD News, Aug. 30, 2017).
We continue our Underweight recommendation on European distressed
As detailed in “European distressed debt fairly valued at present" (LCD News, Feb. 24, 2016), the European distress ratio, defined as the percentage of issues in the ICE BofAML Euro High Yield Index that are quoted at distressed levels (OAS of 1,000 bps or more), can be used to derive a leading indicator of the speculative-grade default rate. The distressed default rate — conceptually, the percentage of distressed issuers that default within one year — decreases as the distress ratio increases. Multiplying the distress ratio by the distressed default rate yields the market's expected 12-month default rate.
At the end of June, the European distress ratio was 11.43%, down from 13.98% one month earlier. Using the methodology described in the above-referenced Feb. 24, 2016, piece, we calculate an expected distressed default rate of 29.76%, indicating that the market is priced for a default rate of 3.4% over the next 12 months. That compares with an implied Moody’s base-case forecast of 5.0%. (We derive this estimate by multiplying Moody’s European bonds-plus-loans forecast of 6.2% by the 0.8125 ratio between the agency’s global bond-only and bond-plus-loans forecasts.) The market’s forecast undershoots the inferred Moody’s base case forecast by 1.6 percentage points. When the European market-implied default rate is one percentage point or more below the Moody’s forecast, we infer from our U.S. research that the distressed sector is likely to produce below-average returns over the coming 12 months. Accordingly, we are maintaining our Underweight recommendation on European distressed debt.
Global HY investors should switch to Underweight on Europe
On June 30, adjusted for differences in ratings mix, European high-yield debt was in the extremely rich zone versus the U.S. During June, the European Equalized Ratings Mix spread tightened by 53 bps, while its U.S. counterpart tightened by just 13.4 bps. The differential between the two regions consequently opened to –45.5 bps from –5.9 bps, moving Europe from moderately rich to extremely rich versus the U.S. We consequently have revised our recommendation to Underweight, from Neutral, on Europe in a cross-border high-yield portfolio. Europe is extremely rich when the ratings-equalized OAS differential between the ICE BofAML Euro Non-Financial Constrained Index and the ICE BofAML US Non-Financial Constrained Index is –12.0 bps or less.
Our current conclusion regarding valuation derives from the Equalized Ratings Mix, or ERM, methodology described in “Europe-versus-U.S. valuation” (LCD News, May 28, 2013). The 2013 report introduced a technique for addressing the analytical challenge that Europe's high-yield market is much more heavily concentrated than its U.S. counterpart in BB issues. A direct comparison of quality spreads between the two regions mainly demonstrates that Europe's high-yield universe is less risky. It does not tell us whether investors are compensated more generously or less generously for a given level of credit risk in Europe than in the U.S. To remedy this problem, we equalize for the vast difference in ratings mix between the two regions to determine which region is trading cheaper, rating for rating.
Neutral weighting still recommended for EM
We are continuing our Neutral recommendation on emerging markets, EM, debt within a portfolio that also includes U.S. high-yield debt. On an ERM basis, the ICE BofAML US Emerging Markets Corporate Plus Index's ERM-based OAS tightened by 73.3 bps in June. Over the same period, the ICE BofAML US High Yield Index's ERM-based OAS tightened by just 23.8 bps. The ERM-basis EM-minus-U.S. high-yield spread consequently ended June at +158.0 bps, down from +207.5 bps in May. That change in ERM spread moved the EM–U.S. differential from the second quartile to the third quartile of historical spreads. Because the third quartile indicates only modest EM overvaluation, we are maintaining our Neutral recommendation on EM.
The backstory on this recommendation is provided in “High-yield relative value, emerging markets versus U.S.” (LCD News, Feb. 9, 2016). That report introduced an analysis of relative value for emerging market corporates and U.S. high-yield. The key to this methodology is adjusting for the substantial difference in ratings mix between the ICE BofA Merrill Lynch High Yield US Emerging Markets Corporate Plus Index and the ICE BofA Merrill Lynch US High Yield Index. After that adjustment, the emerging markets sector invariably has a wider OAS than U.S. high-yield, but the magnitude of the differential varies widely over time. In the equity market, similarly, emerging markets are perennially accorded lower multiples than the U.S., reflecting concerns about the rule of law and corporate governance.
Loans are close to extreme richness versus bonds
Our Neutral rating continues on leveraged loans in a portfolio that also includes high-yield bonds. As the chart below indicates, however, even a modest continuation of the recent trend will thrust loans into extreme richness versus bonds by next month. Our relative value index swung from near parity, at 0.04, in May to –0.86 in June.
 |
Recent short-run swings in the relative values of these two asset classes are unlike any seen in the previous decade. The first time our index moved outside the Fair Value zone (–1 to 1) was November 2010. Not until 35 months later did it reach an extreme in the opposite direction. The interval between swings from one extreme to the other then steadily shortened, to 23, then 17, then 15 months between February 2017 and May 2019. At that point, the pace really picked up, with the next swing to the opposite extreme coming five months later and the one after that in just four months. Finally, loans lurched from extremely rich in February 2020 to extremely cheap the very next month. Now, after just two more months, loans are once again very close to being extremely rich. For lenders, who often seek to finance in the market that is most overvalued from the investor’s standpoint, the most favorable place to raise capital has truly become a moving target.
Details of our relative valuation methodology for the two categories of debt appeared in “Loans vs. bonds – Determining relative value” (LCD News, April 26, 2017). In brief, we compare the three-year discounted spread on the S&P/LSTA Leveraged Loan Index and the OAS on the ICE BofA US High Yield Index, after first adjusting for differences in ratings mix between the two asset classes. We convert the difference in these spreads into an index geared to one standard deviation from the mean in either direction. A reading of plus 1.0 indicates that bonds are extremely rich versus loans, and a reading of minus 1.0 indicates that loans are extremely rich versus bonds. Inside those bands, we recommend Neutral weightings of loans and bonds.
Research assistance by Lu Jiang and Zhiyuan Mei.
ICE BofA Index System data is used by permission. Copyright © 2020 ICE Data Services. The use of the above in no way implies that ICE Data Services or any of its affiliates endorses the views or interpretation or the use of such information or acts as any endorsement of Lehmann, Livian, Fridson Advisors, LLC's use of such information. The information is provided "as is" and none of ICE Data Services or any of its affiliates warrants the accuracy or completeness of the information.


