U.S. banking stocks got routed in December 2018, underperforming the broader market. Last month, the median total return of the banks and thrifts in the S&P Global Market Intelligence analysis was negative 12.7% and the market-cap weighted SNL U.S. Bank and Thrift index lost 14.3% of its value. The S&P 500's total return was negative 9.0% in December 2018.

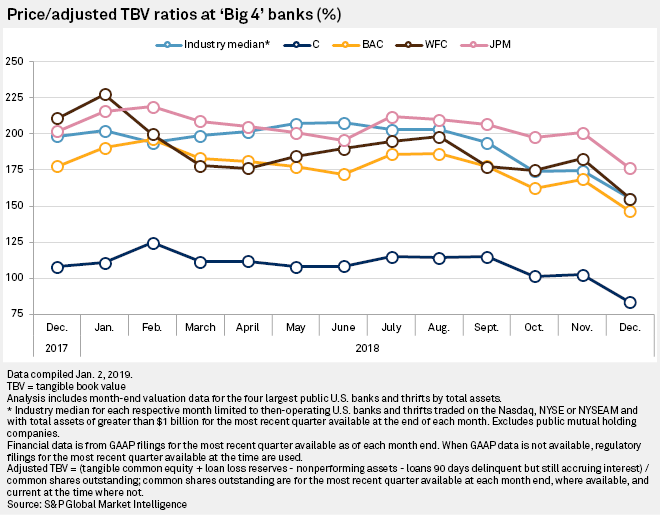
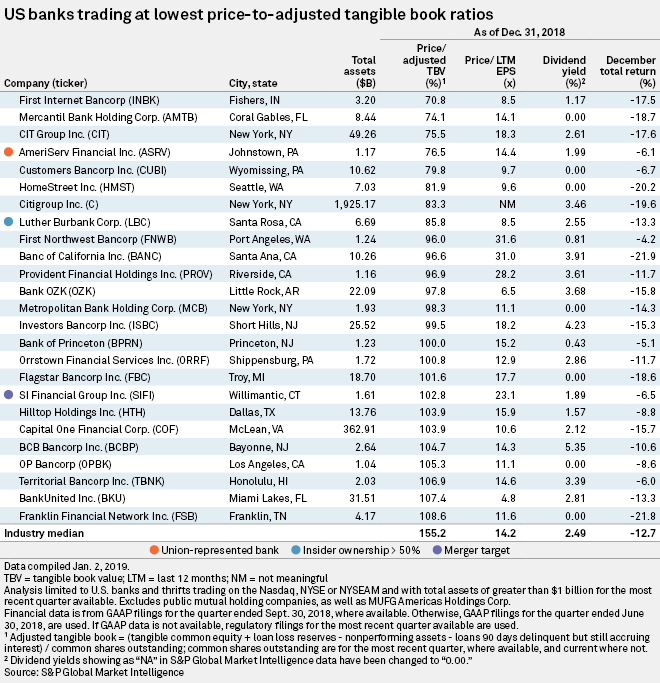
The "Big 4" U.S. banks were unable to avoid the market carnage, as each of them experienced double-digit percentage dips in the month. Citigroup Inc., which traded at the seventh lowest price-to-adjusted tangible book value as of Dec. 31, 2018, was the weakest performer in this group, with a negative total return of about 20%. Bank of America Corp., Wells Fargo & Co. and JPMorgan Chase & Co. declined 12.7%, 15.1% and 12.2%, respectively. Only JPMorgan was trading at a premium to the industry median at the end of 2018.

First Internet Bancorp ended 2018 as the lowest-priced U.S. banking stock in the analysis by P/ATBV, at 70.8%. A year earlier, the stock had traded at 144.6% of ATBV. The company announced a $10 million share repurchase plan on Dec. 19, 2018.
Coral Gables, Fla.-based Mercantil Bank Holding Corp. was No. 2 on the list, with a P/ATBV of 74.1%. The company closed an initial public offering of class A shares and repurchased class B shares last month.
Entering the December list were Santa Ana, Calif.-based Banc of California Inc., Troy, Mich.-based Flagstar Bancorp Inc., McLean, Va.-based Capital One Financial Corp., Miami Lakes, Fla.-based BankUnited Inc. and Franklin, Tenn.-based Franklin Financial Network Inc.
The five exits from the list were Renton, Wash.-based First Financial Northwest Inc., Woodbridge, N.J.-based Northfield Bancorp Inc., Stroudsburg, Pa.-based ESSA Bancorp Inc., Toano, Va.-based C&F Financial Corp. and Louisville, Ky.-based Limestone Bancorp Inc.

Did you enjoy this analysis? Click here to set up real-time alerts for data-driven articles on the U.S. financial sector. Click here for a webinar on creating a template for price-to-adjusted tangible book value. Click here to see S&P Global Market Intelligence's calculations for price-to-adjusted tangible book value as of Dec. 31, 2018. Click here for a template that provides pricing trends and profitability ratios for financial institutions.
|


