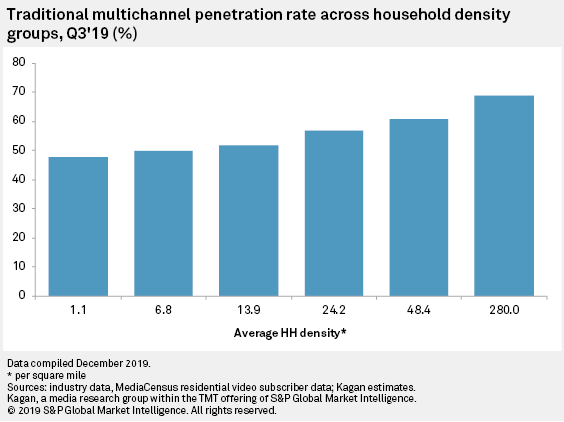
Traditional multichannel cord-cutting is disproportionately affecting the United States's less-populated areas, according to an analysis of Kagan's MediaCensus residential video subscriber data.
With an estimated 82.3 million residential video subscribers, the national traditional multichannel penetration rate dropped to 65.2% as of Sept. 30, 2019. But a 21 percentage-point gap separated the nation's least populated counties from the most populous ones.
This may seem counterintuitive given the broadband gap between rural and urban areas, and an assumption that rural populations are less likely to have access to relatively inexpensive streaming video alternatives.
But it is important to keep in mind that affordability is one of the primary drivers behind cord-cutting. Rural areas are more often than not comprised of more economically vulnerable households.
Moreover, the economics of multichannel services are more challenging for the small operators that tend to serve rural areas. With video margins slipping into negative territory, smaller operators are increasingly less aggressive about chasing customers than their larger peers.
The dynamic also extends to satellite services, which, despite their scale, are losing subs at a significantly faster rate than their wireline competitors. This retreat from traditional multichannel has disproportionately impacted rural areas, where satellite penetrations tend to be higher.

Our analysis of the traditional multichannel penetration rate across variously populated areas involved a multi-step process.
First, we compiled household, household per square mile and MediaCensus' traditional multichannel subscriber data at the county level.
Second, we divided the nation's more than 3,000 counties into six groups based on household-per-square mile data, aggregating households and video subscribers across each of the six categories to calculate their traditional multichannel penetration rates.


