
This blog is written and published by S&P Global Market Intelligence, a division independent from S&P Global Ratings. Lowercase nomenclature is used to differentiate S&P Global Market Intelligence credit scores from the credit ratings issued by S&P Global Ratings.
Over the past two years, the global macroeconomic environment has been characterized by a confluence of challenges. Mounting inflations and geopolitical tensions have compounded concerns, resulting in tightening labor markets and supply chain bottlenecks. According to S&P Global Ratings, corporate defaults jumped 80% in 2023.[1] Even with some recent interest rate cuts in Canada and Europe, future cuts may be limited, and interest rates could still stay high for longer. Therefore, it is critical to distinguish between companies genuinely at risk of defaulting and those that will ultimately survive.
S&P Global Market Intelligence’s Early-Warning Signals (EWS) framework is designed to provide timely warning signals for early detection of entities with genuine risk of defaulting, expressed in an intuitive, traffic light colour scale.[2] This blog delves into an out-of-sample test, spanning from January 1, 2022, to December 31, 2023, to answer a frequently asked question: how did the EWS framework help navigating credit risk volatility in 2022 - 2023?
The test dataset mainly covers S&P Global Ratings' rated entities, as well as key development defaulters.[3] Specifically speaking, defaulter sample includes debt defaults, bankruptcies, and corporates rated as CC or below,[4],[5] while non-defaulter sample consists of corporates rated as CCC- or above.
As shown in Table 1 below, the EWS Framework exhibits excellent and robust performance in detecting default events during 2022 - 2023. It achieves around 90% hit rates, with relatively low, around 30% false alarm rates. On average, the EWS framework generates high risk warning signals (“red” signals) more than 21 months prior to default events, providing enough buffer with asset managers and risk analysts for further investigations.
Table 1: EWS Performance by Year
|
Year |
Hit Rate[6] |
False Alarm Rate[7] |
Average Leading Time[8] |
|
2022 |
90.2% |
27.8% |
21 Months |
|
2023 |
91.7% |
30.3% |
22 Months |
Source: S&P Global Market Intelligence as of March 19, 2024. For illustrative purposes only.
Zooming into both defaulter and non-defaulter samples and looking at the data on a daily basis, we have observed that the daily hit rates increase, when approaching the actual default events, as depicted in Figure 1 below. Within one year prior to defaults, the daily hit rate consistently exceeds 80%, showing the robustness of the EWS signals. In addition, it is exciting to see the daily false alarm rates between 2022 and 2023 remain relatively low, fluctuating around 20%.
Figure 1: EWS Daily Hit Rate and False Alarm Rate
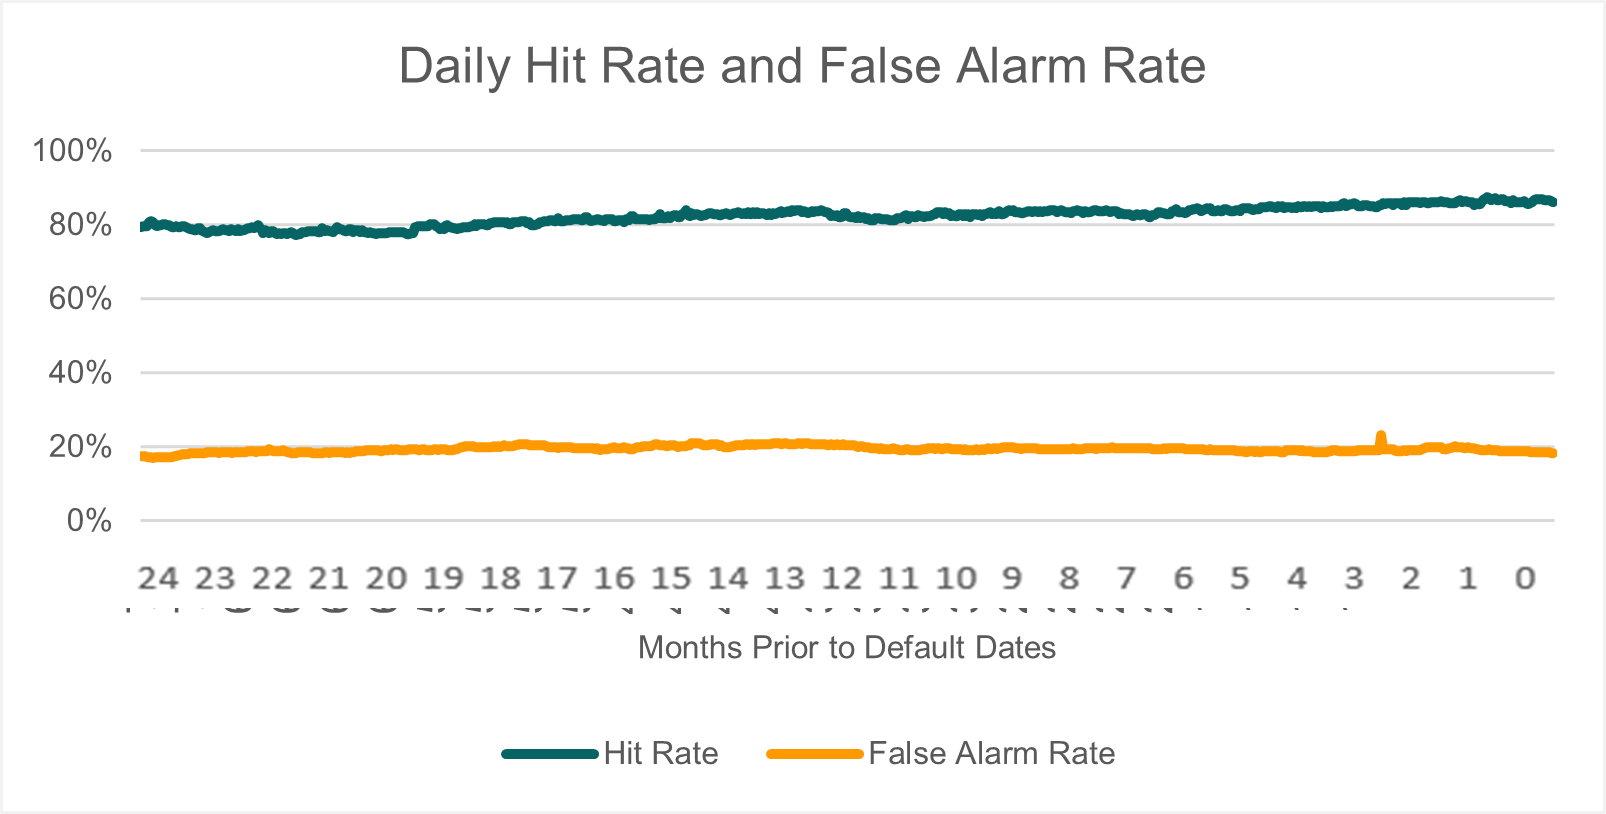
Source: S&P Global Market Intelligence as of March 19, 2024. For illustrative purposes only.
If we breakdown the latest 2023 data by region, we have observed high hit rates exceeding 90% across all regions, and relatively low false alarm rates fluctuating around 30%, as shown in Figure 2 below. The even better performance compared to the development sample underscores the reliability of the EWS framework.
Figure 2: 2023 EWS Performance by Region[9]
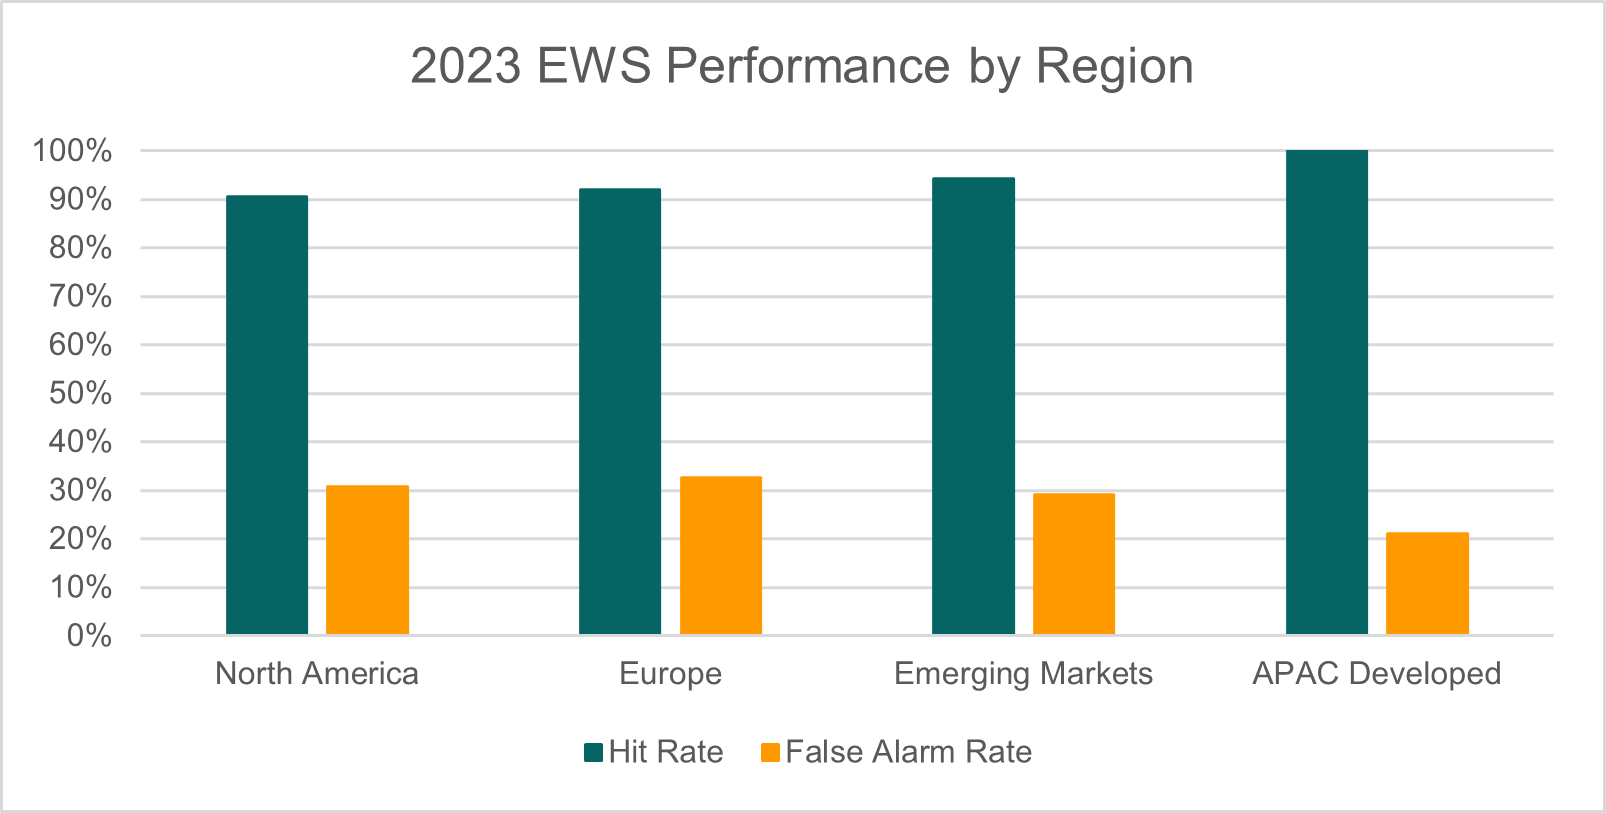
Source: S&P Global Market Intelligence as of March 19, 2024. For illustrative purposes only.
A breakdown by industry is also outlined in the figure below.[1] Most industries are observed with more than 80% hit rates, with relatively low false alarm rates, ranging from 16% to 47%.
Figure 3: EWS Performance by Industry (2022 - 2023)
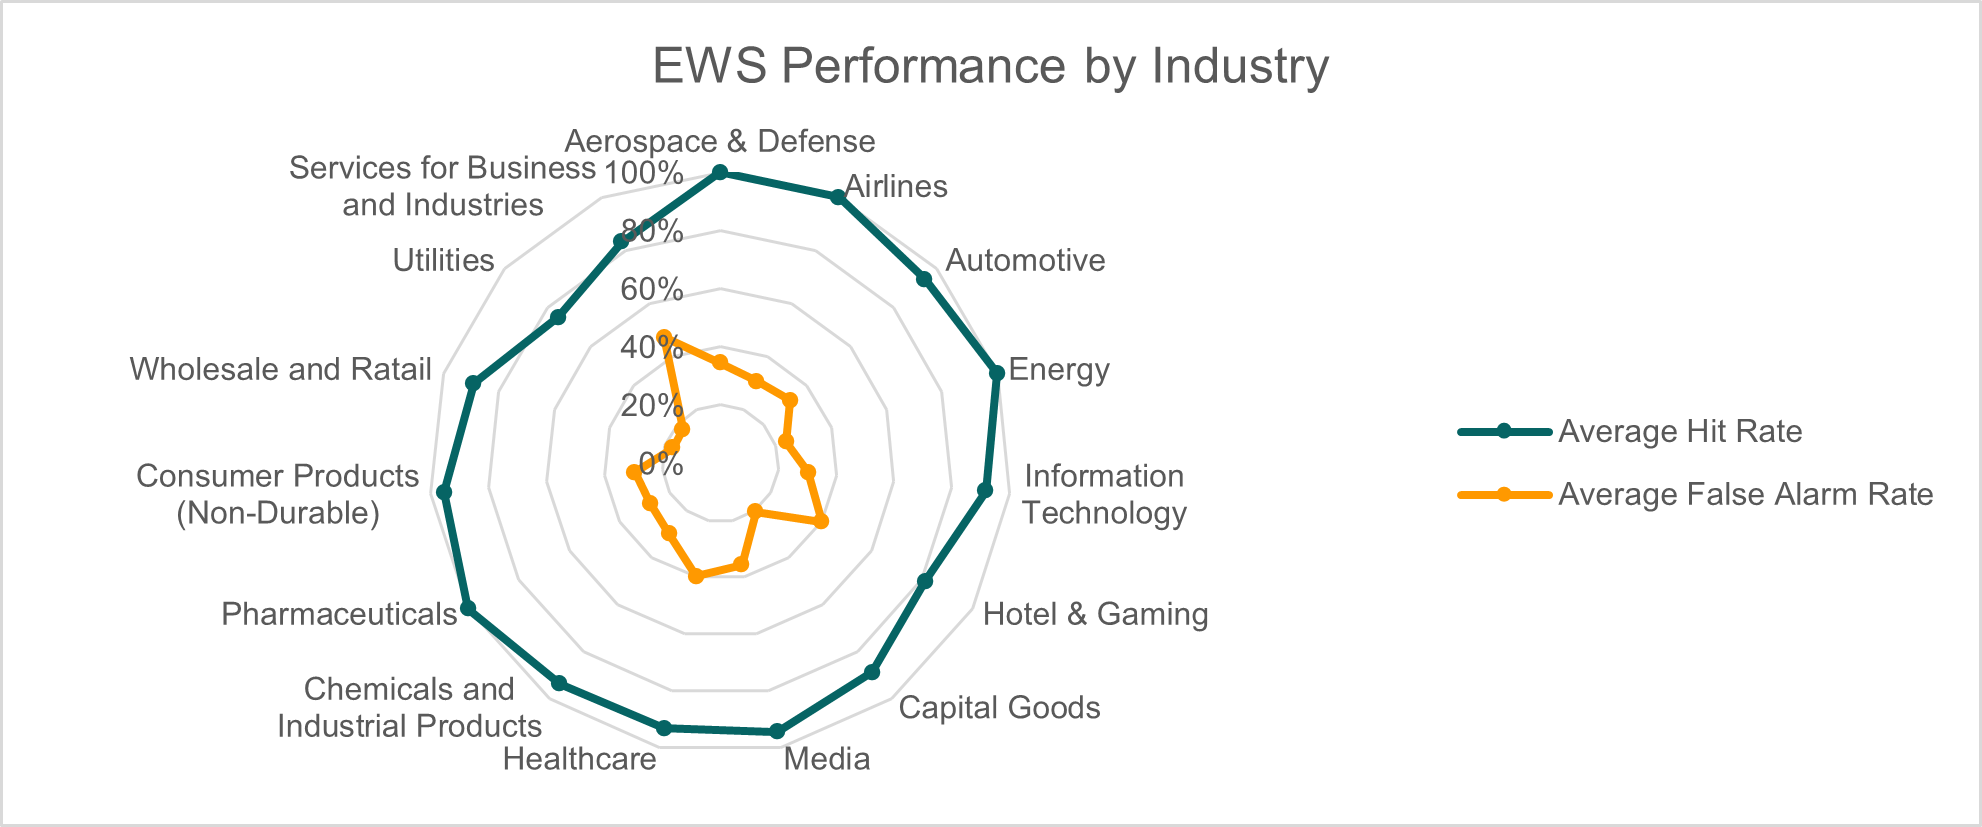
Source: S&P Global Market Intelligence as of March 19, 2024. For illustrative purposes only.
In conclusion, this out-of-sample test showcases the reliability of the EWS Framework 1.0 in identifying defaults during 2022 - 2023, for different regions and industries, globally. Incorporating both absolute and relative PD levels, we gain valuable insights into the level and trend of creditworthiness. Nowadays, with less than expected interest rate cuts despite inflation progress, risk managers and investors can navigate the uncertainty with greater agility and foresight, by adopting an automatic, effective, and flexible[1] EWS framework.
If you want to learn more about RiskGaugeTM and EWS, please click here.
[1]Default, Transition, and Recovery: Corporate Defaults Jumped 80% In 2023 To 153 | S&P Global Ratings (spglobal.com)
[2] Please refer to the Early Warning Signals Framework 1.0 White Paper.
[3] Source: The S&P Capital IQ® Platform.
[4] Key development defaulters and corporates rated as CC or below are included to increase the sample size.
[5] Only the first default event for companies with multiple defaults during the analysis period was selected.
[6] Hit rate = Number of defaulters triggered “red” / Number of defaulters
[7] False alarm rate = Number of non-defaulters triggered “red” / Number of non-defaulters
[8] Average leading time = Average time prior to default event dates when observations first triggered “Red”
[9] ASEAN is merged with Emerging Market due to limited number of observations.
[10] Only industries with more than 100 observations are plotted for illustrative purpose.
[11] There will be tunable risk appetite settings to have either more or less high-risk signals in the future releases, which will add flexibility and help improving performance even further for different types of portfolios.