S&P Global Offerings
Featured Topics
Featured Products
Events
S&P Global Offerings
Featured Topics
Featured Products
Events
S&P Global Offerings
Featured Topics
Featured Products
Events
Banking & Capital Markets
Economy & Finance
Energy Transition & Sustainability
Technology & Innovation
Podcasts & Newsletters
Banking & Capital Markets
Economy & Finance
Energy Transition & Sustainability
Technology & Innovation
Podcasts & Newsletters
S&P Global Offerings
Featured Topics
Featured Products
Events
10 Oct, 2017
Capital Markets

By David Pope
Highlights
Co-written by Frank Zhao, Director, Quantamental Research, S&P Global Market Intelligence
What CEO word choice and sentence structure can tell us about growth sentiment
“I think from our perspective, we've always viewed this business as attractive in terms of its core business of selling into OEMs, as well as servicing cloud service providers at one level, but really the opportunity to, I think, as architectures evolve and different customer needs evolve, to have the capability to optimize the devices either at the device level, at the subsystem level or the systems level, and if you do not have the software capability to do that, you really cannot take advantage of what we think would be a potentially significant long-term trend.”
-Seagate Technology Chariman & CEO Stephen J. Luczo in
Q2 2017 Quarterly Earnings Conference Call , April 26, 2017
The quote above from Seagate Technology’s calendar Q2 2017 earnings conference call features CEO Stephen Luczo answering a question posed by an analyst from Guggenheim Securities about the company’s recent acquisition strategy. If the language and sentence structure looks overly complex to you, you’re not alone. Seagate’s Q2 earnings call ranked as one of the most complicated among S&P 500 companies that quarter, according to a new analysis conducted by S&P Global Market Intelligence’s Quantamental Research team.
According to the group’s new report, Natural Language Processing – Part 1: Primer(opens in a new tab), CEOs using more words per sentence or increasing the number of polysyllabic words in their earnings calls, can be telltale signs of future earnings and share price declines. Perhaps it should come as little surprise, then, that Seagate has lost approximately 35% of its market between April 26, 2017 and September 7, 2017.
The research applies natural language processing (NLP) to S&P 500 corporate earnings call transcripts to dissect the tone, complexity, and overall level of engagement with analysts as indicators of earnings sentiment. It finds the following:
While the full research(opens in a new tab) contains a detailed review of the methodology used and the various syntactical parsing, lexicon normalization, and object standardization techniques that were applied to conduct the analysis, the real takeaways for investors come in the form of real-world application of the research to the previous year’s quarterly earnings transcripts from S&P 500 companies.
Background on the study
The Natural Language Processing – Part 1: Primer(opens in a new tab) research was undertaken by S&P Global Market Intelligence’s Quantamental Research team to demystify many aspects of NLP by providing concrete illustrations of how the technology can be used to quantify the sentiment of earnings calls.
By leveraging computers and statistical models, NLP allows financial researchers to automatically process and make sense of language in a systematic and sensible way. NLP can read through documents at a rate far more rapidly than humans. This allows text to be consumed en masse and then aggregated. NLP can also score the sentiment of a document, look for troubling words (litigation, adjusted, etc.), and score the complexity of speech used.
Results
1) Heat map of quarterly earnings sentiment
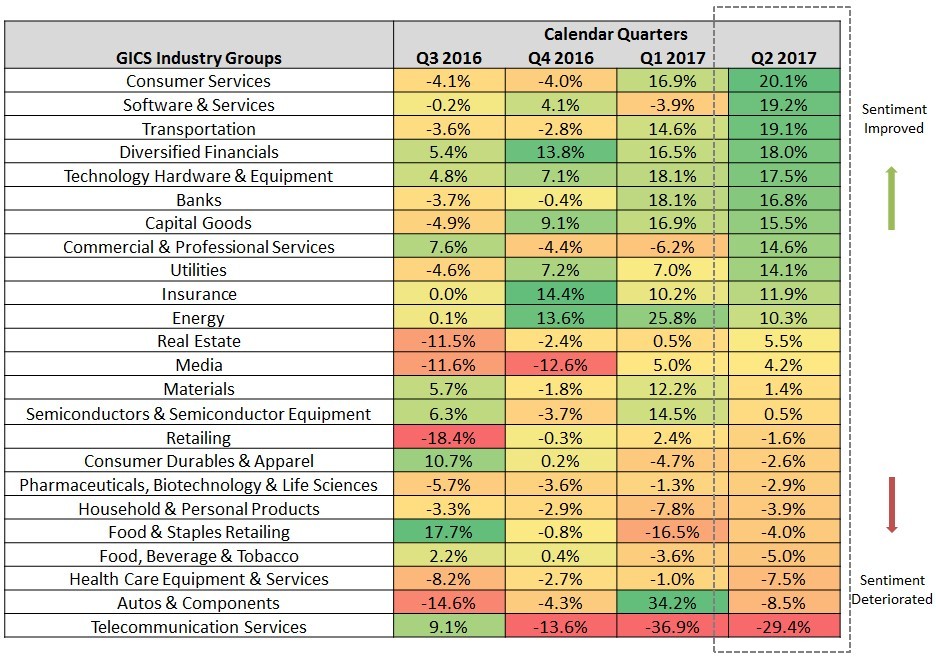
Researchers applied the NLP analysis to 24 Global Industry Classification Standard (GICS) industry groups of the S&P 500 by calendar quarter between Q3 2016 and Q2 2017 to create a heat map of sentiment based on the proportion of negative words in each earnings call. Exhibit 1 shows the various industry groups sorted by sentiment changes from Q2 2017 in descending order. All the sentiment values are quarter-over-quarter changes from four quarters ago where each industry group’s sentiment is aggregated, on an equal-weighted basis, from the stock-level where the sentiment is measured using the proportion of negative words in a stock’s earnings call.
S&P 500 Earnings Call Sentiment Trends
Source: S&P Global Market Intelligence Quantamental Research as of 8/8/17 (charts are for illustrative purposes only)
One could easily visualize sentiment trends for an industry group and spot potential inflection points. For example, the sentiment improved substantially for banks and tech firms between calendar quarter Q4 2016 and Q1 2017. Investors would notice this as an inflection point to the upside to potentially use as an additional piece of information in their investment decision-making process. By contrast, the sentiment level for automotive and equipment firms and telecommunications companies deteriorated significantly over the one-year period.
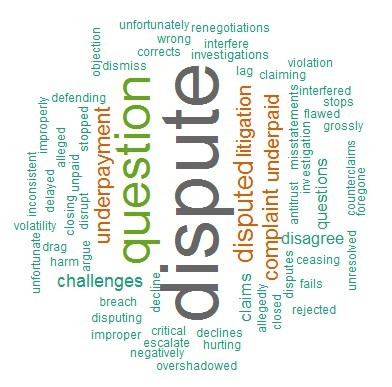
As an example of what kinds of words contribute to a negative sentiment reading in the analysis, the research team points to Qualcomm’s Q2 earnings call, in which company management discussed its ongoing legal battle with Apple over royalties. Exhibit 2 below depicts a visual representation of most frequently used negative words on that call.
Qualcomm Q2 Earnings Call Negative Word Cloud
Source: S&P Global Market Intelligence Quantamental Research (charts are for illustrative purposes only)
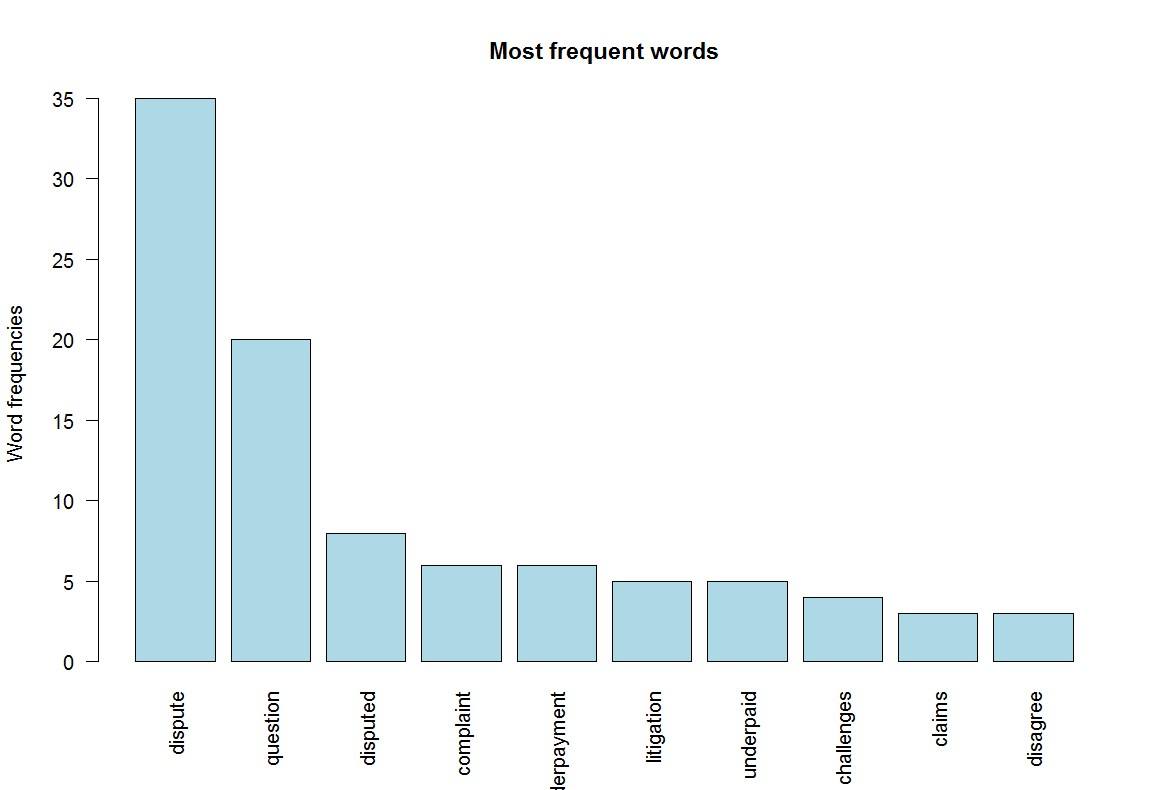
As Exhibit 3 indicates, the word “dispute” was used a total of 35 times in the single call.
Qualcomm Q2 Earnings Call Negative Word Count
Source: S&P Global Market Intelligence Quantamental Research as of 8/8/17 (charts are for illustrative purposes only)
2) Evaluating language complexity and analyst engagement
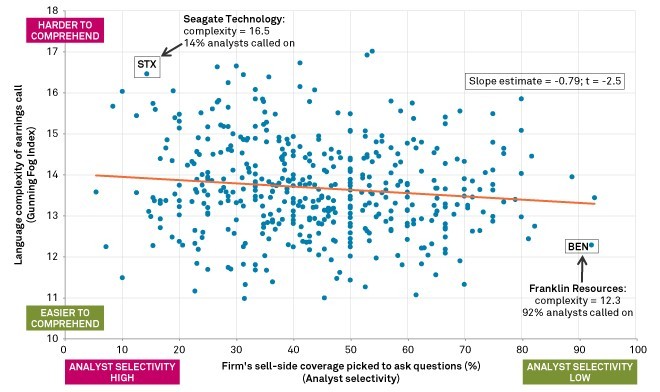
The research found that company management tends to use more words and complexity when explaining bad news. In the example of Seagate Technology’s Q2 earnings call mentioned at the opening of this piece, the language used throughout the call was scored as a 16.5 on the Gunning fog index, which measures the number of years of formal education that one needs to understand the diction used in the analyzed text. A score of 16 is equivalent to someone who has completed an undergraduate degree. To understand the Seagate call, the average listener would need to have completed his or hers first year of post-graduate study.
When applied to the S&P 500 as a whole, the research found that the average number of words per sentence and the proportion of polysyllabic words used in an earnings call was higher for firms disclosing negative news, such as an earnings miss, and those with higher levels of complexity in their language took fewer questions from analysts (Exhibit 4).
Language Complexity and Analyst Engagement
Source: S&P Global Market Intelligence Quantamental Research as of 8/8/17 (charts are for illustrative purposes only)
3) Measuring the impact of analyst engagement
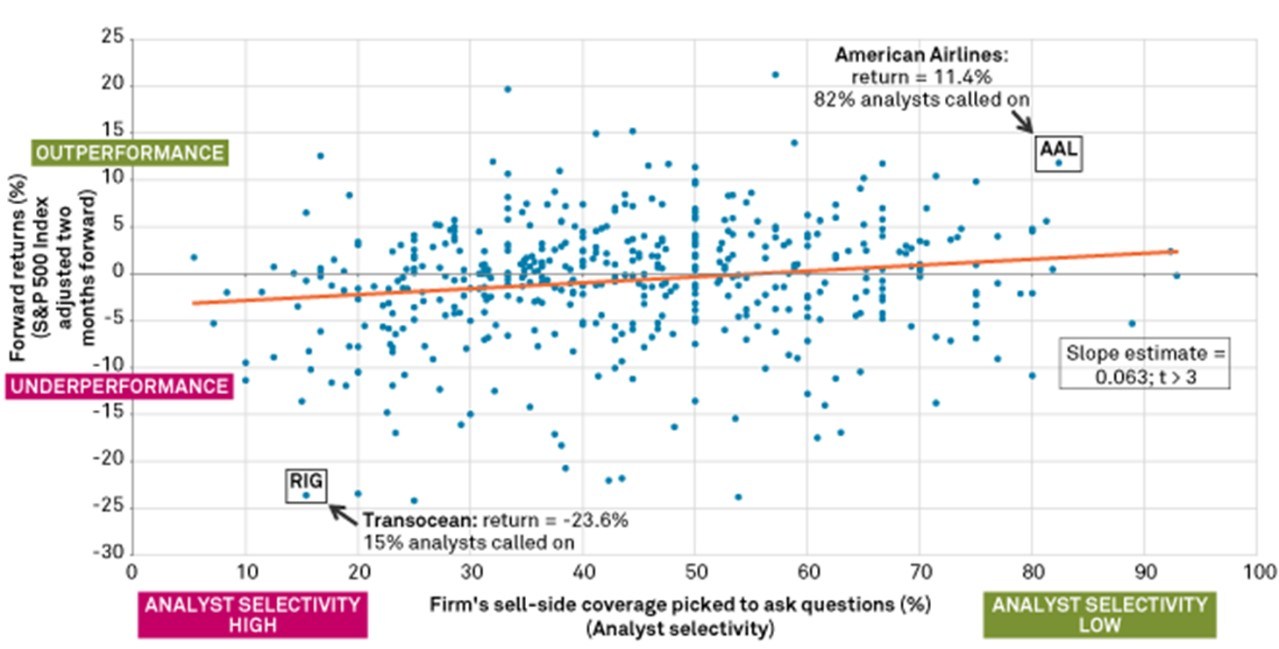
The study also analyzed the overall level of engagement between company management and sell-side analysts using a sell-side analyst selectivity ratio, which is defined as the percent of the active sell-side coverage that are allowed to ask questions during an earnings call. For instance, Apple Inc. had forty active sell-side analysts covering the company prior to one of its earnings calls and its management allowed 10 of the analysts to ask questions, which translates to an analyst selectivity ratio of 25%. The analysis interprets this as a high analyst selectivity ratio and viewed negatively.
The study’s hypothesis is that when a firm has good financial results, it wants everyone to know, especially sell-side analysts because they are great messengers to buy-side money managers. Answers to sell-side questions tend to be shorter and more direct when firms are doing well, which in turn enables managers to allow more analyst questions. When financial results are less favorable, the percent of sell-side analysts who get to ask questions declines due to two possible reasons. One is that managers tend to have lengthier explanations as to why the negative results are perhaps transitory, which consumes additional time that would otherwise be allocated to taking additional analyst questions. Secondly, managers may take multiple questions from analysts who may have a positive view on their firms.
Exhibit 5 demonstrates that S&P 500 companies that took questions from a smaller proportion of sell-side analysts in Q2 underperformed by an average of 2.14% over the following two months.
Analyst Engagement and Stock Performance
Source: S&P Global Market Intelligence Quantamental Research as of 8/8/17 (charts are for illustrative purposes only)
Access the full study: Natural Language Processing – Part 1: Primer(opens in a new tab). You can also view additional research from S&P Global Market Intelligence’s Quantamental Research team here(opens in a new tab).
Research in the media
Our Quantamental Research team’s work on natural language processing has been highlighted in several recent publications. Read more below.
AI decodes trading signals hidden in jargon(opens in a new tab), Financial Times, October 25, 2017
If You Hear Big Words on an Earnings Call, Get Ready for Bad News(opens in a new tab), Bloomberg, October 17, 2017
There’s a link between CEOs who torture the English language and poor stock performance(opens in a new tab), MarketWatch, October 14, 2017
Learn more about our solutions for investment managers(opens in a new tab)

