Customer Logins
Obtain the data you need to make the most informed decisions by accessing our extensive portfolio of information, analytics, and expertise. Sign in to the product or service center of your choice.
Customer Logins
ECONOMICS COMMENTARY
May 20, 2019
Comparisons of US regional business surveys, the ISM and IHS Markit PMI
- IHS Markit PMI data outperform ISM and regional manufacturing surveys in accurately predicting official data
- ISM and regional surveys exhibit high correlation with each other but both have overstated growth in recent years
- IHS Markit PMI accurately predicted fall in official output in Q1 and hint at further weakness in Q2
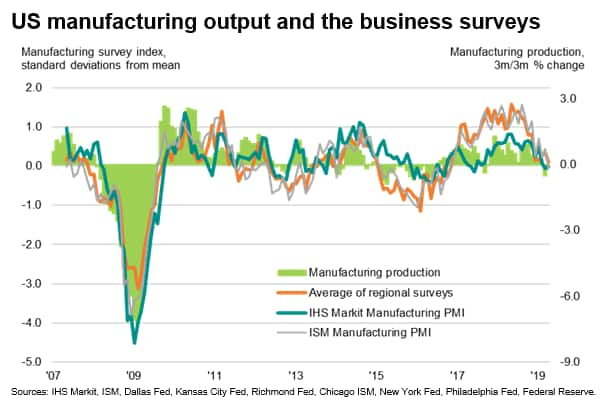
There is an array of manufacturing business surveys published, designed to give early insights into the health of the goods-producing economy, but only the IHS Markit PMI accurately anticipated the downturn in factory output recorded in the first quarter of 2019. The IHS Markit survey has consistently beaten its rivals in recent years due to its unmatched coverage of the national manufacturing economy.
Survey correlations
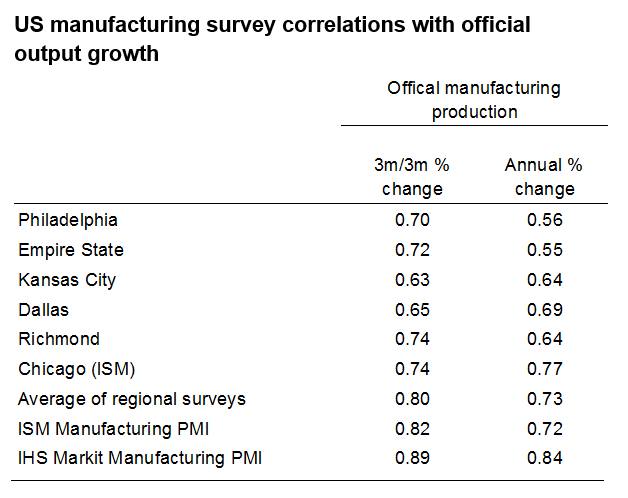
To gain an insight into the track record of the manufacturing business surveys in terms of their ability to accurately anticipate actual official factory production data (as calculated by the Federal Reserve), we look at how the survey indicators correlate with both the three-month-on-three-month and annual rates of change in the official data.
We analyse the following headline indices from the surveys:
• IHS Markit US Manufacturing PMI
• ISM US Manufacturing PMI
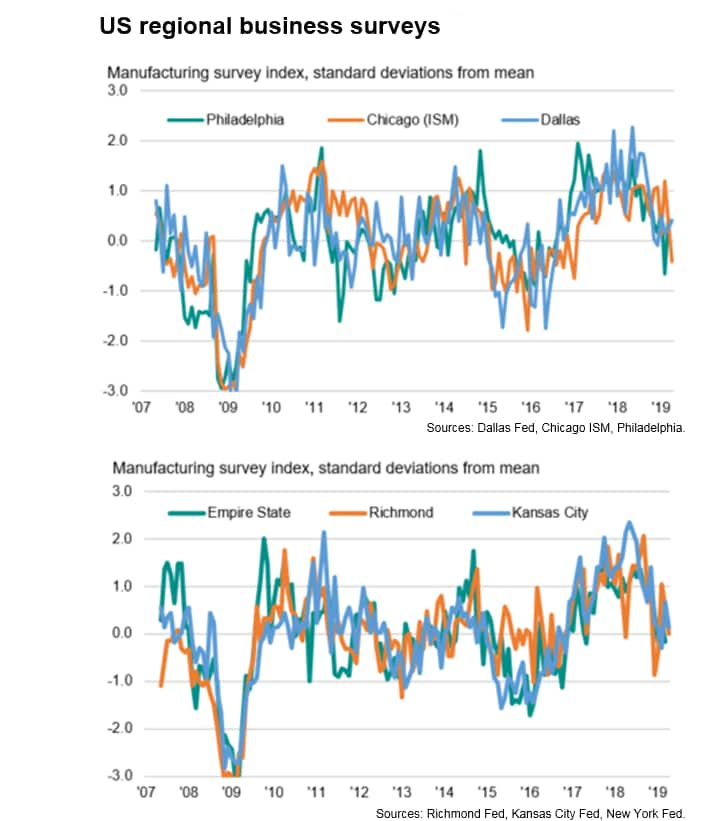
• Philadelphia Fed general business activity index
• Chicago purchasing managers business barometer
• Empire State Manufacturing Survey, general business conditions index
• Kansas City Fed Manufacturing Survey, present conditions index
• Dallas Fed manufacturing production index
• Richmond Fed Manufacturing Survey, present conditions index
The latter six regional surveys are also aggregated together to form a single index, using a simple arithmetic mean.
Comparisons with the official data since 2007 (the earliest date from when equivalent comparisons can be made across all survey indices) reveal that the highest correlation with the three-month-on-three-month growth rate of the official data is achieved by the IHS Markit PMI at 0.89, followed by the ISM at 0.82.
When looking at the relationships with the annual rate of change in the official data, the highest correlation is again achieved by the IHS Markit PMI at 0.84, followed by the Chicago ISM at 0.77.
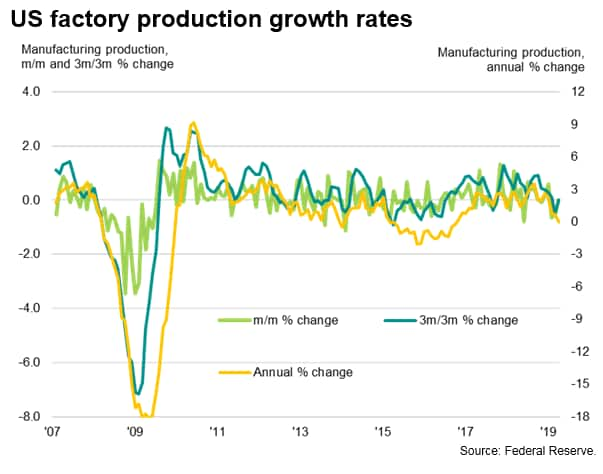
Lower correlations are observed across the board with month-on-month changes due to the high volatility of the official data (see section 'Comparing with official growth rates' at the end of this report).
Charting the data highlights how the ISM and the aggregated regional surveys correlate closely, but that both overstated actual manufacturing growth for much of late 2016- to late 2018, an overstatement which is not observed in the IHS Markit data. Research by Macroeconomic Advisers in fact finds evidence of a structural break in the ISM relationship with the official data, which appears to be replicated in the regional surveys (but not seen in the IHS Markit data).
Poor start to 2019
Recent months have, however, seen the surveys all come into line, having fallen from robust levels last year, albeit with the IHS Markit PMI falling further from its long-run average than both the ISM and regional survey average. The IHS Markit PMI was consequently alone in accurately predicting the decline in output registered by the official data in the first quarter of 2019. The 0.5% decline was the first recorded by the official numbers since the third quarter of 2017, which was also the last time that the IHS Markit PMI had indicated a downturn.
To calculate the implied rate of change in the official data we use a simple OLS regression model which uses the IHS Markit PMI's output index as the sole explanatory variable of the three-month change in manufacturing production. The implied decline in output in March was -0.6%, easing to -0.3% in April.
Second quarter signals
The April IHS Markit survey data therefore hint at the manufacturing downturn extending into the start of the second quarter, albeit with the rate of decline slowing. May's flash PMI numbers are published on 23rd May, and will provide further insight into second quarter performance.
Meanwhile, this analysis suggests some caution should be used in using survey data: the regional surveys can be collectively used as a useful guide to the ISM survey numbers, but cannot be used to predict the IHS Markit PMI numbers. However, the evidence also suggests that neither can the ISM or regional surveys be used to accurately predict the official data. For that, the IHS Markit numbers have developed the strongest track record, and are fortunately among the earliest published each month: flash PMI data are issued approximately one week before the end of each month, with data relating to business conditions in that month.
Causes of survey divergence
The cause of the divergence of the business surveys in recent years is not clear, though the out-performance of the IHS Markit and ISM survey relative to the regional surveys is likely a consequence of the ISM and IHS Markit surveys covering national manufacturing rather than specific regions.
The outperformance of the IHS Markit data relative to the ISM is less obvious, though is likely a consequence of ISM only surveying large companies while the IHS Markit survey covers small, medium and large companies in the correct proportions, as defined by the official data.
The IHS Markit survey is also the only survey to incorporate a national weighting system for its survey responses based on company size and sector contribution to total manufacturing output, ensuring each company's response contributes appropriately to the survey index each month.
Comparing with official growth rates
We generally compare survey data with the three-month-on-three-month growth rate of official data. This is because the month-on-month changes tend to be very volatile, and the three-month growth rate acts as a smoother guide to official growth rates. Annual growth rates are also often useful to compare against as they tend to be even less noisy than the three-month rate of change, though tend to lag.
Chris Williamson, Chief Business Economist, IHS
Markit
Tel: +44 207 260 2329
chris.williamson@ihsmarkit.com
© 2019, IHS Markit Inc. All rights reserved. Reproduction in whole or in part without permission is prohibited.
Purchasing Managers' Index™ (PMI™) data are compiled by IHS Markit for more than 40 economies worldwide. The monthly data are derived from surveys of senior executives at private sector companies, and are available only via subscription. The PMI dataset features a headline number, which indicates the overall health of an economy, and sub-indices, which provide insights into other key economic drivers such as GDP, inflation, exports, capacity utilization, employment and inventories. The PMI data are used by financial and corporate professionals to better understand where economies and markets are headed, and to uncover opportunities.
This article was published by S&P Global Market Intelligence and not by S&P Global Ratings, which is a separately managed division of S&P Global.
{"items" : [
{"name":"share","enabled":true,"desc":"<strong>Share</strong>","mobdesc":"Share","options":[ {"name":"facebook","url":"https://www.facebook.com/sharer.php?u=http%3a%2f%2fwww.spglobal.com%2fmarketintelligence%2fen%2fmi%2fresearch-analysis%2fus-regional-business-surveys-the-ism-and-ihs-markit-pmi-200519.html","enabled":true},{"name":"twitter","url":"https://twitter.com/intent/tweet?url=http%3a%2f%2fwww.spglobal.com%2fmarketintelligence%2fen%2fmi%2fresearch-analysis%2fus-regional-business-surveys-the-ism-and-ihs-markit-pmi-200519.html&text=Comparisons+of+US+regional+business+surveys%2c+the+ISM+and+S%26P+Global+PMI+%7c+S%26P+Global+","enabled":true},{"name":"linkedin","url":"https://www.linkedin.com/sharing/share-offsite/?url=http%3a%2f%2fwww.spglobal.com%2fmarketintelligence%2fen%2fmi%2fresearch-analysis%2fus-regional-business-surveys-the-ism-and-ihs-markit-pmi-200519.html","enabled":true},{"name":"email","url":"?subject=Comparisons of US regional business surveys, the ISM and S&P Global PMI | S&P Global &body=http%3a%2f%2fwww.spglobal.com%2fmarketintelligence%2fen%2fmi%2fresearch-analysis%2fus-regional-business-surveys-the-ism-and-ihs-markit-pmi-200519.html","enabled":true},{"name":"whatsapp","url":"https://api.whatsapp.com/send?text=Comparisons+of+US+regional+business+surveys%2c+the+ISM+and+S%26P+Global+PMI+%7c+S%26P+Global+ http%3a%2f%2fwww.spglobal.com%2fmarketintelligence%2fen%2fmi%2fresearch-analysis%2fus-regional-business-surveys-the-ism-and-ihs-markit-pmi-200519.html","enabled":true}]}, {"name":"rtt","enabled":true,"mobdesc":"Top"}
]}


