Customer Logins
Obtain the data you need to make the most informed decisions by accessing our extensive portfolio of information, analytics, and expertise. Sign in to the product or service center of your choice.
Customer Logins
ECONOMICS COMMENTARY
Oct 04, 2018
US economy slows and prices spike higher amid signs of capacity constraints
- IHS Markit PMI data point to economy growing at annualised rate approaching 3% in Q3
- Slower growth compared to earlier in the year reflects signs of peaking demand and rising capacity constraints
- Prices charged rise at steepest rate in survey history
- Employment growth highest for over three years as firms expand capacity
September PMI survey data added to signs that the US economy continued to expand at a solid rate in the third quarter, albeit with the pace of expansion down on that seen in the second quarter.
At least some of the slowdown can be attributed to capacity constraints limiting growth in many companies, despite firms stepping up their hiring. A consequence was a further acceleration in price pressures as demand often exceeded supply. Average prices charged for goods and service rose at the fastest rate seen in the survey's nine-year history.
Slower growth in September
Looking across both manufacturing and services, business activity growth slowed for a fourth straight month in September. At 53.9, the final seasonally adjusted IHS Markit U.S. Composite PMI™ Output Index dipped from 54.7 in August. The latest reading was the lowest since January.
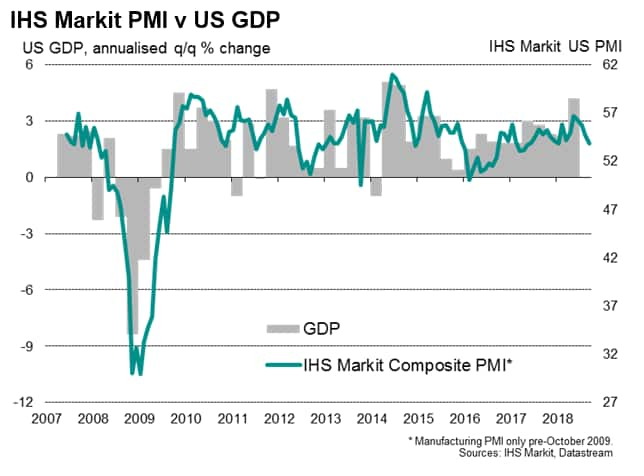
Service sector business growth has eased considerably since peaking back in May to reach an eight-month low in September, more than offsetting an improvement in manufacturing output growth during the month to the highest since May.
The combined survey results suggest that the pace of economic growth continued to run close to a 3% annualised rate over the third quarter. This would mark a slower rate of economic expansion than the second quarter, albeit with the economy still enjoying robust growth.
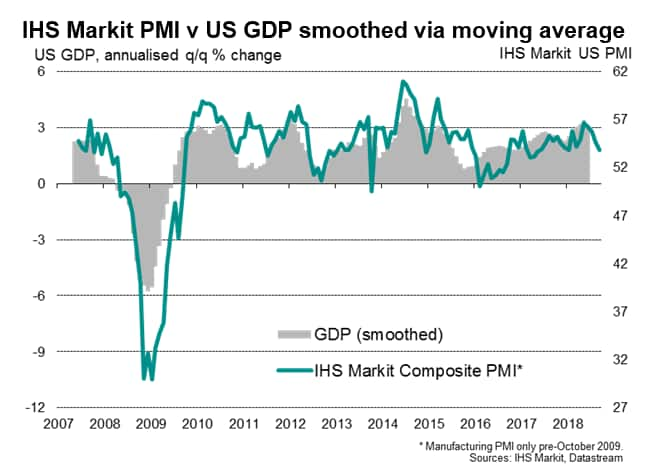
A key question is to what extent the slowdown represents an underlying weakening of demand in recent months, or whether supply-side factors are constraining activity. In this respect, the survey data suggest that both factors may be at play.
Peaking demand growth?
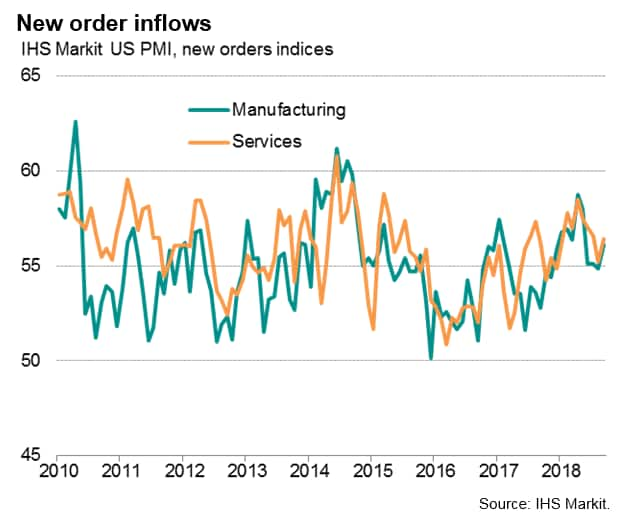
From a demand perspective, order books look encouragingly resilient and robust. New order inflows across both sectors ‒ the best gauge of changing demand conditions ‒ rose to a three-month high in September, climbing above the survey's long run average.
However, the rate of growth of new orders has cooled slightly compared to the highs seen in the first half of the year, reflecting a moderation of demand growth since the spring which is apparent in both manufacturing and services.
Capacity indicators hint at supply constraints
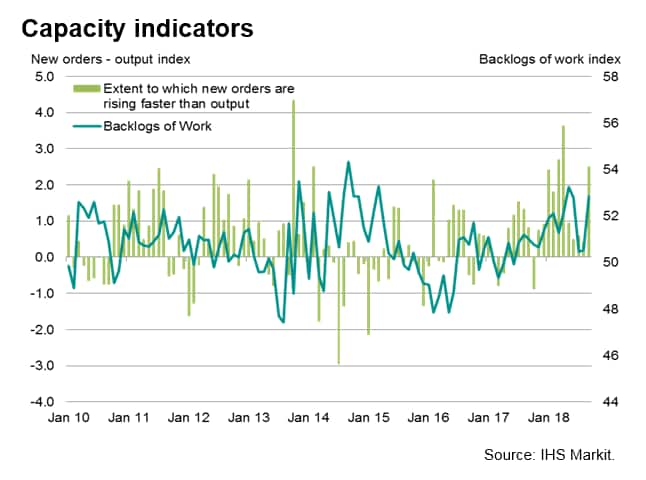
Importantly, the overall rate of growth of new business continued to run ahead of output, with the gap in fact widening in September. An increasing gap suggests that companies are failing to build capacity at a sufficient pace to keep up with growing demand.
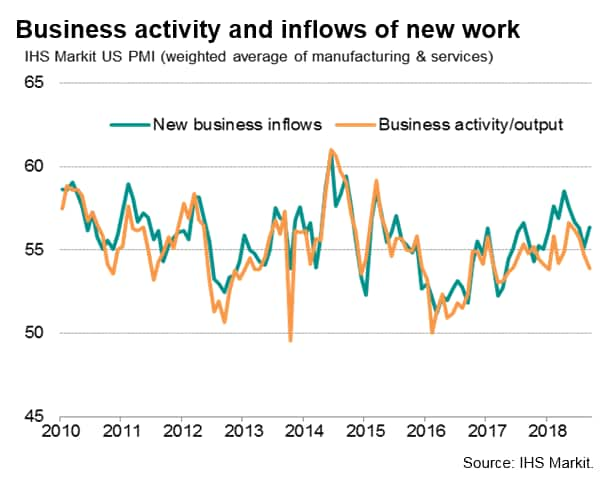
Capacity pressures are also being indicated by a rise in the survey's backlogs of work index, which reflects the build-up of uncompleted orders at both manufacturing and service sector companies. September saw one of the strongest rises in service sector backlogs over the past three-and-a-half years, while manufacturers reported the joint-steepest increase seen over the past three years. Overall backlogs of work consequently accumulated across the economy at one of the fastest rates since 2014.
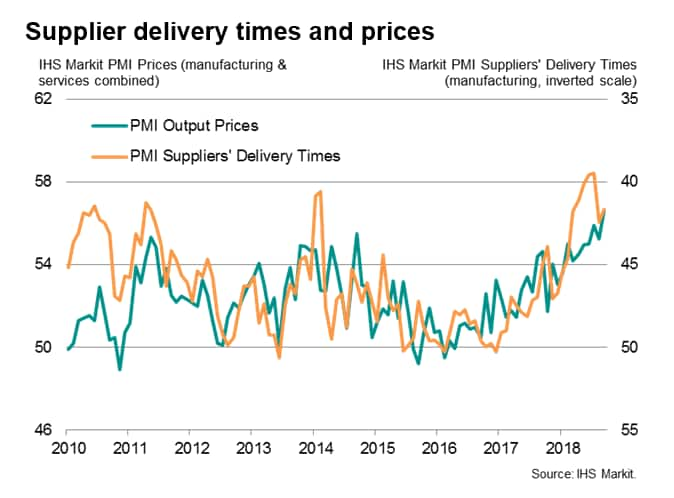
A final indication that the economy is increasingly lacking spare capacity is provided by average supplier delivery times lengthening to the greatest extent seen in the survey's nine-year history. Longer lead-times simply reflect suppliers struggling to provide goods due to high demand, representing a constraint on production capacity at factories waiting for inputs.
Prices rise at survey record rate
With a variety of survey indications suggesting that demand is exceeding supply, a rise in price pressures should come as no surprise. The PMI surveys showed average prices charged for goods and services rising in September at the steepest rate yet recorded since comparable survey data were available in 2009.
Job creation fastest for over three years
Firms are meanwhile hiring in increasing numbers in order to expand capacity to meet fuller order books. The composite employment index from the manufacturing and services surveys climbed to its highest for over three years in September, indicative of a further non-farm payroll rise in excess of 200,000.
Higher employment may eventually help bring demand and supply into balance, therefore pushing down prices, but economic theory suggests that the ever-tightening labour market will exert higher upward pressure on pay.
© 2018, IHS Markit Inc. All rights reserved. Reproduction in
whole or in part without permission is prohibited.
Chris Williamson, Chief Business Economist, IHS
Markit
Tel: +44 207 260 2329
chris.williamson@ihsmarkit.com
Purchasing Managers' Index™ (PMI™) data are compiled by IHS Markit for more than 40 economies worldwide. The monthly data are derived from surveys of senior executives at private sector companies, and are available only via subscription. The PMI dataset features a headline number, which indicates the overall health of an economy, and sub-indices, which provide insights into other key economic drivers such as GDP, inflation, exports, capacity utilization, employment and inventories. The PMI data are used by financial and corporate professionals to better understand where economies and markets are headed, and to uncover opportunities.
This article was published by S&P Global Market Intelligence and not by S&P Global Ratings, which is a separately managed division of S&P Global.
{"items" : [
{"name":"share","enabled":true,"desc":"<strong>Share</strong>","mobdesc":"Share","options":[ {"name":"facebook","url":"https://www.facebook.com/sharer.php?u=http%3a%2f%2fwww.spglobal.com%2fmarketintelligence%2fen%2fmi%2fresearch-analysis%2fus-economy-slows-and-prices-spike-higher-031018.html","enabled":true},{"name":"twitter","url":"https://twitter.com/intent/tweet?url=http%3a%2f%2fwww.spglobal.com%2fmarketintelligence%2fen%2fmi%2fresearch-analysis%2fus-economy-slows-and-prices-spike-higher-031018.html&text=US+economy+slows+and+prices+spike+higher+amid+signs+of+capacity+constraints+%7c+S%26P+Global+","enabled":true},{"name":"linkedin","url":"https://www.linkedin.com/sharing/share-offsite/?url=http%3a%2f%2fwww.spglobal.com%2fmarketintelligence%2fen%2fmi%2fresearch-analysis%2fus-economy-slows-and-prices-spike-higher-031018.html","enabled":true},{"name":"email","url":"?subject=US economy slows and prices spike higher amid signs of capacity constraints | S&P Global &body=http%3a%2f%2fwww.spglobal.com%2fmarketintelligence%2fen%2fmi%2fresearch-analysis%2fus-economy-slows-and-prices-spike-higher-031018.html","enabled":true},{"name":"whatsapp","url":"https://api.whatsapp.com/send?text=US+economy+slows+and+prices+spike+higher+amid+signs+of+capacity+constraints+%7c+S%26P+Global+ http%3a%2f%2fwww.spglobal.com%2fmarketintelligence%2fen%2fmi%2fresearch-analysis%2fus-economy-slows-and-prices-spike-higher-031018.html","enabled":true}]}, {"name":"rtt","enabled":true,"mobdesc":"Top"}
]}


