Customer Logins
Obtain the data you need to make the most informed decisions by accessing our extensive portfolio of information, analytics, and expertise. Sign in to the product or service center of your choice.
Customer Logins
ECONOMICS COMMENTARY
Jun 12, 2019
US consumer price inflation cools amid signs of weaker pricing power
- Weaker than expected inflation seen as CPI falls to 1.8% in May
- Easing follows slide in PMI survey price gauges, which suggest further downside risk to inflation
- Capacity indicators hint at lower pricing power
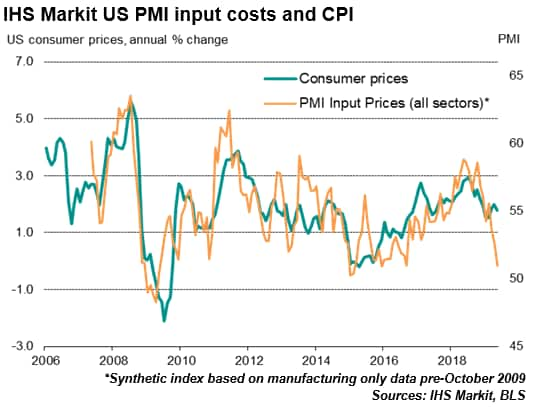
Markets were caught out by a sharper than expected weakening of consumer price inflation in May, though the cooling trend had been signalled in advance by IHS Markit's PMI surveys, which hint strongly at further downward pressure on prices in coming months.
Weaker than expected inflation
With markets increasingly pricing-in Fed rate cuts in 2019, weaker consumer price data are needed to add justification for looser policy. May's consumer price data showing an easing in the annual rate of inflation from 2.0% in April to 1.8% therefore boosted expectations of the Fed tilting further to the dovish side at next week's FOMC meeting. Markets had merely anticipated an easing to 1.9%.

The easing was in fact less than had been indicated by IHS Markit's recent PMI business surveys, which suggest that inflationary pressures fell markedly in May, therefore posing further downside risks to prices in coming months.
Selling prices and costs gauges slump
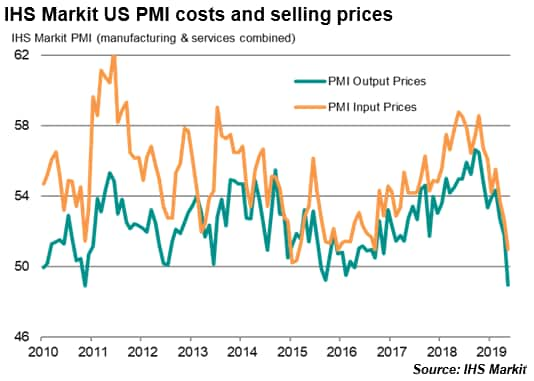
One of the clearest indications of lower price pressures from the PMI surveys was a near-stagnation of average selling prices for goods and services. This gauge had been signalling a marked rate of selling price inflation as recently as February, but recent months have seen the rate moderate considerably, with an especially marked lurch down in May. Average prices charged for services in fact fell in May (albeit only marginally) for the first time since February 2016. Goods producers meanwhile reported the smallest rise in prices levied at the factory gate since November 2016.

The surveys have also recorded a steep cooling of input cost inflation, which fell in May to the lowest since September 2016. The latest increase was only modest and contrasted markedly with steep rates of increase seen between late-2016 and the early months of 2019, albeit with the rate of increase now having steadily eased since peaking last May. Input cost pressures cooled in both manufacturing and services.
Weaker demand growth
One of the factors driving the slide in price pressures has been a swift reversal of demand conditions, with strongly rising demand seen from late-2016 through to early 2019 fading in recent months. The IHS Markit PMI surveys showed new orders across both manufacturing and services rising in May to the second-weakest extent seen this side of the global financial crisis. Manufacturing fared worse than services, with factory new orders declining for the first time since August 2009. However, the survey also brought signs of weakness spreading to the service sector, where new business growth slumped in May to one of the weakest rates since the global financial crisis.
Capacity indicators hint at lower pricing power
We use two survey gauges to assess the impact of weakened demand growth on the inflation picture.
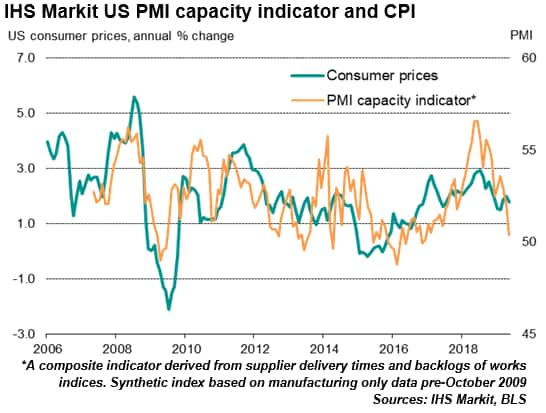
First, suppliers' delivery times reveal to what extent suppliers are struggling (or not) to provide goods on a timely basis. Longer deliveries tend to result in higher prices, as demand outpaces supply. Such a situation was evident up to early-2019, but in recent months there are signs that supply has come into line with demand for many products, reducing suppliers' pricing power. May saw the lowest incidence of supplier delays since December 2016.
A similar situation is evident in the surveys' backlogs of work indices. At times of demand exceeding supply, backlogs of work tend to accumulate in companies, which often means firms are more confident to ask higher prices to new customers. Again, such a situation was evident in early-2019 but is now showing signs of reversing. The May surveys saw no change in backlogs, with stagnation seen in both manufacturing and services.
A combined capacity indicator gauge - which is derived from the PMI's suppliers' delivery times index and backlogs of work index and provides an accurate guide to underlying inflationary trends - fell in May to its lowest since December 2016.

The data therefore suggest that a weakening of underlying inflationary pressures could exert further downward momentum on consumer prices in coming months.
For more information contact economics@ihsmarkit.com.
Chris Williamson, Chief Business Economist, IHS
Markit
Tel: +44 207 260 2329
chris.williamson@ihsmarkit.com
The intellectual property rights to the US Manufacturing PMI™ provided herein are owned by or licensed to IHS Markit. Any unauthorised use, including but not limited to copying, distributing, transmitting or otherwise of any data appearing is not permitted without IHS Markit's prior consent. IHS Markit shall not have any liability, duty or obligation for or relating to the content or information ("data") contained herein, any errors, inaccuracies, omissions or delays in the data, or for any actions taken in reliance thereon. In no event shall IHS Markit be liable for any special, incidental, or consequential damages, arising out of the use of the data. Purchasing Managers' Index™ and PMI™ are either registered trade marks of Markit Economics Limited or licensed to Markit Economics Ltd. IHS Markit is a registered trademark of IHS Markit Ltd.
IHS Markit is a registered trademark of IHS Markit Ltd. All other company and product names may be trademarks of their respective owners © 2019 IHS Markit Ltd. All rights reserved.
© 2019, IHS Markit Inc. All rights reserved. Reproduction in whole
or in part without permission is prohibited.
Purchasing Managers' Index™ (PMI™) data are compiled by IHS Markit for more than 40 economies worldwide. The monthly data are derived from surveys of senior executives at private sector companies, and are available only via subscription. The PMI dataset features a headline number, which indicates the overall health of an economy, and sub-indices, which provide insights into other key economic drivers such as GDP, inflation, exports, capacity utilization, employment and inventories. The PMI data are used by financial and corporate professionals to better understand where economies and markets are headed, and to uncover opportunities.
This article was published by S&P Global Market Intelligence and not by S&P Global Ratings, which is a separately managed division of S&P Global.
{"items" : [
{"name":"share","enabled":true,"desc":"<strong>Share</strong>","mobdesc":"Share","options":[ {"name":"facebook","url":"https://www.facebook.com/sharer.php?u=http%3a%2f%2fwww.spglobal.com%2fmarketintelligence%2fen%2fmi%2fresearch-analysis%2fus-consumer-price-inflation-cools-amid-signs-of-weaker-pricing-power-190612.html","enabled":true},{"name":"twitter","url":"https://twitter.com/intent/tweet?url=http%3a%2f%2fwww.spglobal.com%2fmarketintelligence%2fen%2fmi%2fresearch-analysis%2fus-consumer-price-inflation-cools-amid-signs-of-weaker-pricing-power-190612.html&text=US+consumer+price+inflation+cools+amid+signs+of+weaker+pricing+power+%7c+S%26P+Global+","enabled":true},{"name":"linkedin","url":"https://www.linkedin.com/sharing/share-offsite/?url=http%3a%2f%2fwww.spglobal.com%2fmarketintelligence%2fen%2fmi%2fresearch-analysis%2fus-consumer-price-inflation-cools-amid-signs-of-weaker-pricing-power-190612.html","enabled":true},{"name":"email","url":"?subject=US consumer price inflation cools amid signs of weaker pricing power | S&P Global &body=http%3a%2f%2fwww.spglobal.com%2fmarketintelligence%2fen%2fmi%2fresearch-analysis%2fus-consumer-price-inflation-cools-amid-signs-of-weaker-pricing-power-190612.html","enabled":true},{"name":"whatsapp","url":"https://api.whatsapp.com/send?text=US+consumer+price+inflation+cools+amid+signs+of+weaker+pricing+power+%7c+S%26P+Global+ http%3a%2f%2fwww.spglobal.com%2fmarketintelligence%2fen%2fmi%2fresearch-analysis%2fus-consumer-price-inflation-cools-amid-signs-of-weaker-pricing-power-190612.html","enabled":true}]}, {"name":"rtt","enabled":true,"mobdesc":"Top"}
]}


