Customer Logins
Obtain the data you need to make the most informed decisions by accessing our extensive portfolio of information, analytics, and expertise. Sign in to the product or service center of your choice.
Customer Logins
ECONOMICS COMMENTARY
Nov 11, 2019
UK avoids recession but underlying growth trend deteriorates
- Economy contracts for second month running, but avoids recession
- Business output edges lower in latest six months
- Disappointing service sector performance adds to manufacturing and construction woes
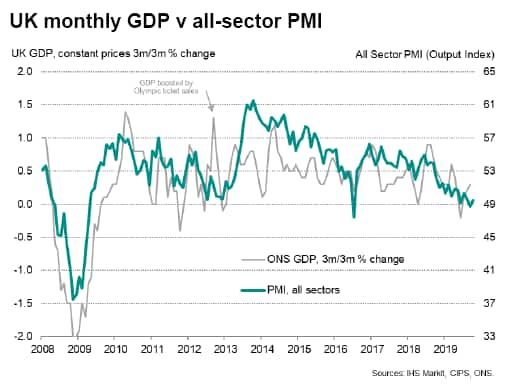
The latest official data show the UK economy contracting for a second successive month in September, matching business survey data. Although a buoyant July meant that the economy grew by 0.3% in the third quarter, avoiding recession, the third quarter rise masks a slowdown that is particularly evident in the business sector, where output has fallen slightly over the past six months on average to register one of the worst periods for businesses since 2009.
Economy contracts…
Official GDP data showed the output of the economy dropping 0.1% in September following a 0.2% decline in August. The contractions correspond with sub-50 all-sector PMI readings seen in both of these months, thereby corroborating the business survey message of an economy that is going through its toughest spell for a decade. This weakness has persisted into the fourth quarter, according to the October PMI numbers.
To underscore the weakness of the economy, not only has the PMI been recording some of the lowest values seen over the past decade in recent months, the annual rate of growth of GDP has also slowed sharply, dropping in the three months to September to just 1.0%, its lowest since the first quarter of 2010.
… but avoids recession
Despite the latest two monthly declines in GDP, a strong July reading meant the economy grew 0.3% over the third quarter as a whole, stronger than the 0.1% decline indicated by the PMI surveys. However, the official quarterly GDP growth estimate likely overstates the health of the economy. Note that a robust 0.3% gain in July was partly a consequence of auto sector output rebounding from Brexit-related shutdowns in the second quarter, which had contributed to a 0.2% GDP fall in the three months to June.
The business survey data often under- or over-state growth if GDP has been heavily influenced by a dramatic change in output in a specific sector of the economy, as has the case with autos so far this year. However, a consequential advantage is that the PMI allows the user to more accurately gauge the underlying trend in the economy. To illustrate, we had flagged that the second quarter decline in GDP probably overstated the weakness of the economy and that third quarter growth would rebound as a result, but that this recovery would in turn overstate the underlying trend. This has since been borne out by the data.
Business output edges lower in latest six months
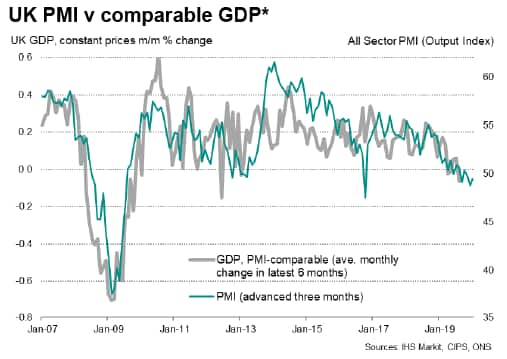
A drill-down into the GDP data provides further corroboration of the PMI's signal of deteriorating business growth in recent months. Looking at comparable coverage of the economy to the PMI, i.e. excluding government, agriculture, energy and retail, the official data show the business growth trend weakening markedly, in line with the PMI.
* Also see our recent paperinvestigating some of the historical divergences of GDP with the PMI
Using an average to smooth out some of the volatility in the GDP numbers, output has fallen on average by 0.06% during the past six months using a PMI-comparable coverage of GDP. Only 2012 and 2009 have seen worst readings on this measure in recent years, which broadly matches the PMI's signal of business enduring its worst spell for a decade in recent months. The PMI over this latest six-month period averaged 49.9.
By comparison, PMI-comparable GDP grew by an average of 0.23% in the same six months of 2018, corresponding with a buoyant PMI average of 54.0, underscoring the recent weakness of both gauges relative to last year.
Disappointing service sector performance adds to manufacturing and construction woes
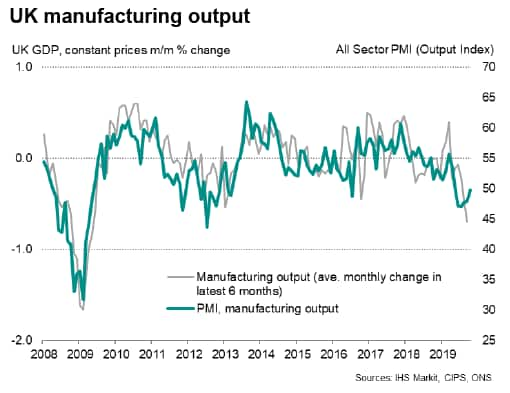
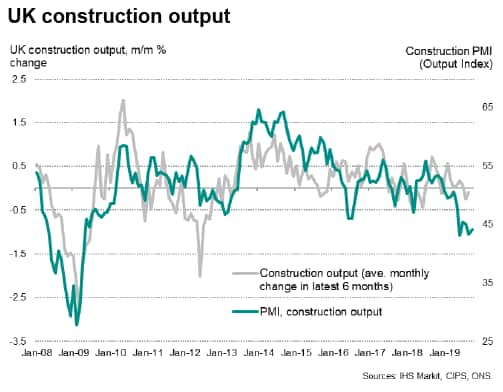
Looking at the sector-level data, the worst performance over the past six months has been observed in manufacturing, where output has fallen by an average of 0.70% each month, which represents its steepest downturn since the early months of 2009. Construction output has meanwhile fallen at an average monthly rate of 0.08%. PMI data for both sectors have also been in decline over this period, albeit with the construction PMI notably weaker than the official data, though we remain sceptical of official construction data as this series is notorious for being heavily revised.
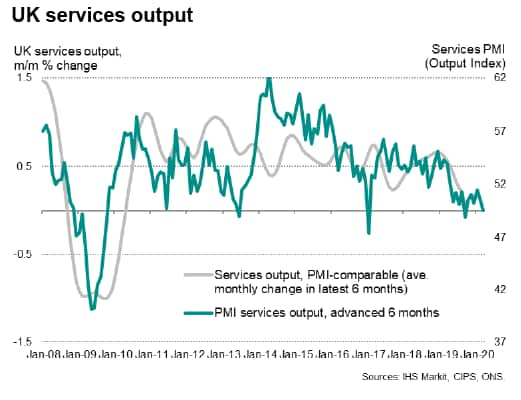
A key development in recent months, however, has been a stalling in the service sector, which was signalled in advance by the PMI and corroborated by the latest official GDP numbers. At 0.08%, average monthly service sector growth in the past six months has been the joint-weakest since the first half of 2016. Using a PMI-definition of coverage (excluding retail and government), average service sector growth of 0.07% in the past six months was the lowest since the six months to April 2010.
Chris Williamson, Chief Business Economist, IHS
Markit
Tel: +44 207 260 2329
chris.williamson@ihsmarkit.com
© 2019, IHS Markit Inc. All rights reserved. Reproduction in whole
or in part without permission is prohibited.
Purchasing Managers' Index™ (PMI™) data are compiled by IHS Markit for more than 40 economies worldwide. The monthly data are derived from surveys of senior executives at private sector companies, and are available only via subscription. The PMI dataset features a headline number, which indicates the overall health of an economy, and sub-indices, which provide insights into other key economic drivers such as GDP, inflation, exports, capacity utilization, employment and inventories. The PMI data are used by financial and corporate professionals to better understand where economies and markets are headed, and to uncover opportunities.
This article was published by S&P Global Market Intelligence and not by S&P Global Ratings, which is a separately managed division of S&P Global.
{"items" : [
{"name":"share","enabled":true,"desc":"<strong>Share</strong>","mobdesc":"Share","options":[ {"name":"facebook","url":"https://www.facebook.com/sharer.php?u=http%3a%2f%2fwww.spglobal.com%2fmarketintelligence%2fen%2fmi%2fresearch-analysis%2fuk-avoids-recession-but-underlying-growth-trend-deteriorates-nov19.html","enabled":true},{"name":"twitter","url":"https://twitter.com/intent/tweet?url=http%3a%2f%2fwww.spglobal.com%2fmarketintelligence%2fen%2fmi%2fresearch-analysis%2fuk-avoids-recession-but-underlying-growth-trend-deteriorates-nov19.html&text=UK+avoids+recession+but+underlying+growth+trend+deteriorates+%7c+S%26P+Global+","enabled":true},{"name":"linkedin","url":"https://www.linkedin.com/sharing/share-offsite/?url=http%3a%2f%2fwww.spglobal.com%2fmarketintelligence%2fen%2fmi%2fresearch-analysis%2fuk-avoids-recession-but-underlying-growth-trend-deteriorates-nov19.html","enabled":true},{"name":"email","url":"?subject=UK avoids recession but underlying growth trend deteriorates | S&P Global &body=http%3a%2f%2fwww.spglobal.com%2fmarketintelligence%2fen%2fmi%2fresearch-analysis%2fuk-avoids-recession-but-underlying-growth-trend-deteriorates-nov19.html","enabled":true},{"name":"whatsapp","url":"https://api.whatsapp.com/send?text=UK+avoids+recession+but+underlying+growth+trend+deteriorates+%7c+S%26P+Global+ http%3a%2f%2fwww.spglobal.com%2fmarketintelligence%2fen%2fmi%2fresearch-analysis%2fuk-avoids-recession-but-underlying-growth-trend-deteriorates-nov19.html","enabled":true}]}, {"name":"rtt","enabled":true,"mobdesc":"Top"}
]}


