Customer Logins
Obtain the data you need to make the most informed decisions by accessing our extensive portfolio of information, analytics, and expertise. Sign in to the product or service center of your choice.
Customer Logins
ECONOMICS COMMENTARY
Sep 07, 2022
S&P Global and ISM service sector surveys compared
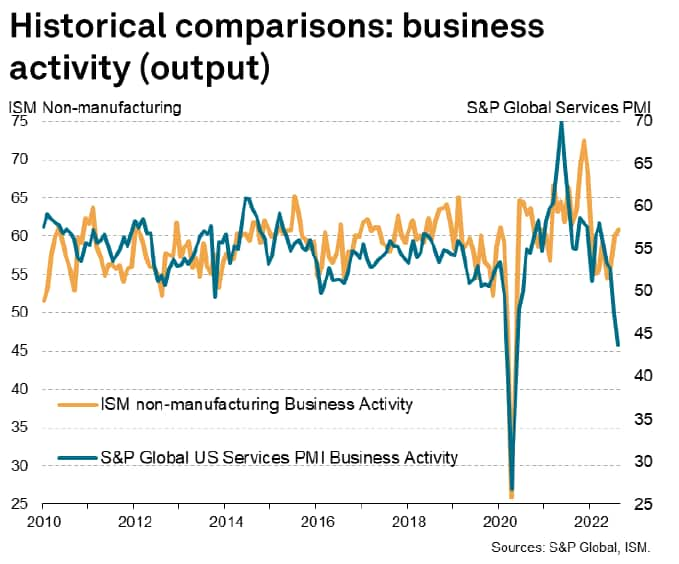
Two different surveys of US service sector business conditions are provided by S&P Global (formerly IHS Markit) and ISM.
In this note we look at some of the differences between the two surveys, which may help explain why the two surveys sometimes diverge to send different signals on the health of the US service sector.
Sector coverage
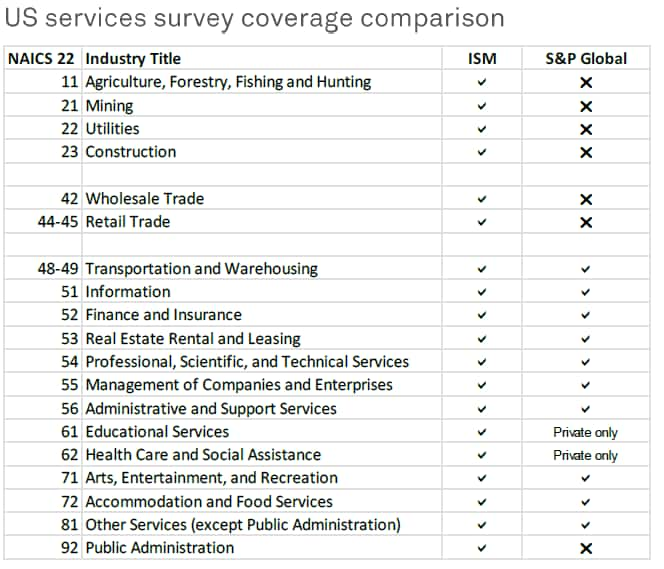
The first, and most striking, difference between the two surveys is that of sector coverage. While the S&P Global PMI for the service sector only includes data provided by companies operating in the US services economy, encompassing a variety of consumer, business and financial services which are provided by the private sector (or otherwise charged for), the ISM services PMI in fact covers any activity other than manufacturing.
The ISM definition therefore includes construction, utilities, agriculture, retail and various aspects of government administration (see table), many of which can blur, dampen or distort the picture of the health of the services economy. Public sector activity, in particular, will tend to dampen any business cycle trend, especially any downturn in private sector activity, hence its exclusion from the S&P Global survey.
Note also that the S&P coverage is consistent with all services PMI in other countries, ensuing international comparability. The wider ISM definition which includes non-services companies in the services PMI means any international comparisons are potentially misleading.
Survey panel sizes
At 400 companies with a typical response rate of 85%, S&P Global's service sector survey panel is thought to be larger than the ISM's panel size, which was previously stated at 300 although any references to actual panel size and response rates no longer appear on ISM press releases. Thus, unlike S&P Global, as far as we can ascertain, ISM does not disclose actual numbers of questionnaires received, making It more difficult to conduct due diligence on data quality.
Company size
Survey respondent bases are different in terms of company size, with S&P Global stratifying its panels not only by sector contribution to GDP but also ensuring an appropriate mix of small, medium and large firms within each sector. In contrast, ISM data are based on ISM members and as such are likely to be biased towards larger companies, with small- and medium-sized firms under-represented.
As smaller firms often behave differently to larger firms during different stages of the economic cycle, or in response to policy changes or international economic conditions, it is important for any survey to ensure robust representation of all different enterprise sizes.
Survey contributors
The surveys are based on responses from different companies: The intention is that the structures of both ISM and S&P Global survey panels accurately reflect the true structure of the economy, though it should be remembered that S&P Global and ISM are in practice likely to approach different companies to participate in their surveys, so the results naturally reflect business conditions at different companies.
Note also that survey respondent bases are different in terms of job function: S&P Global surveys extend to other job functions, while ISM data are based purely on purchasing and supply professionals. Note that S&P Global moved away from purely focusing on the purchasing profession as such roles were found to have often been less suitable to surveys outside of manufacturing, where the purchasing manager is often less involved in the main commercial activities of the firms and is more occupied in office and IT supplies, etc. Contributors to S&P Global's services surveys are typically from a finance or other C-level role or, in smaller firms, managing director or owner.
Questionnaires
Whereas ISM use questions relating to supply chain management (including stocks of inventories), S&P Global found this type of question to often be irrelevant for many service industries. S&P Global instead focusses on core questions of greater relevance to commercial activities in sectors such as banking, legal and accounting services.
Weighting systems
S&P Global surveys use a weighting system to ensure the results accurately reflect the true official structure of the economy. Weights reflect both company size and the relative importance of the sub-sector in which the company operates. A large company in a large sector will therefore account for a proportionally higher weight in the survey results than a small company in a smaller sector. We understand that ISM surveys do not include such a weighting process in the calculation of the results but are instead dependent on the panels being 'self-weighting'.
Seasonal adjustment
The surveys use different methods of seasonal adjustment, with S&P Global PMIs using X13 to estimate seasonal adjustment factors for the latest numbers every month. ISM, in contrast, uses a system whereby the coming year's seasonal adjustment factors are forecast in advance. The ISM methodology means that the latest data are not in fact used in the seasonal factor estimation process, which becomes an increasingly significant disadvantage as the calendar year proceeds. ISM also revises its seasonal adjustment factors, whereas S&P Global makes no such revisions.
Headline PMI calculation
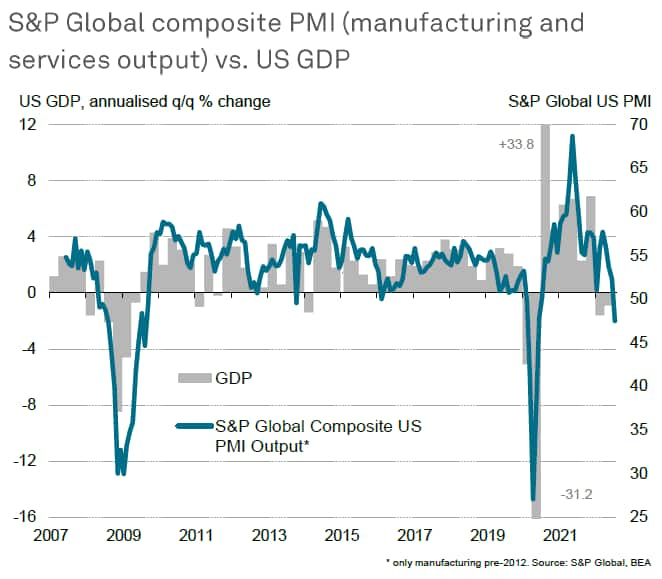
ISM produces a composite headline PMI for services, based on individual indices including new orders, business activity, employment, supplier lead time and inventories. S&P Global does not see any value in compiling such an aggregate index and prefers instead to just use the Business Activity Index as the survey headline, as this measures the overall output of the sector. This services activity gauge can be easily aggregated with the equivalent output index for manufacturing to produce a reliable and timely guide to overall economic growth, or GDP.
Chris Williamson, Chief Business Economist, S&P Global Market Intelligence
Tel: +44 207 260 2329
chris.williamson@spglobal.com
© 2022, IHS Markit Inc. All rights reserved. Reproduction in whole
or in part without permission is prohibited.
Purchasing Managers' Index™ (PMI™) data are compiled by IHS Markit for more than 40 economies worldwide. The monthly data are derived from surveys of senior executives at private sector companies, and are available only via subscription. The PMI dataset features a headline number, which indicates the overall health of an economy, and sub-indices, which provide insights into other key economic drivers such as GDP, inflation, exports, capacity utilization, employment and inventories. The PMI data are used by financial and corporate professionals to better understand where economies and markets are headed, and to uncover opportunities.
This article was published by S&P Global Market Intelligence and not by S&P Global Ratings, which is a separately managed division of S&P Global.
{"items" : [
{"name":"share","enabled":true,"desc":"<strong>Share</strong>","mobdesc":"Share","options":[ {"name":"facebook","url":"https://www.facebook.com/sharer.php?u=http%3a%2f%2fwww.spglobal.com%2fmarketintelligence%2fen%2fmi%2fresearch-analysis%2fsp-global-and-ism-service-sector-surveys-compared.html","enabled":true},{"name":"twitter","url":"https://twitter.com/intent/tweet?url=http%3a%2f%2fwww.spglobal.com%2fmarketintelligence%2fen%2fmi%2fresearch-analysis%2fsp-global-and-ism-service-sector-surveys-compared.html&text=S%26P+Global+and+ISM+service+sector+surveys+compared+%7c+S%26P+Global+","enabled":true},{"name":"linkedin","url":"https://www.linkedin.com/sharing/share-offsite/?url=http%3a%2f%2fwww.spglobal.com%2fmarketintelligence%2fen%2fmi%2fresearch-analysis%2fsp-global-and-ism-service-sector-surveys-compared.html","enabled":true},{"name":"email","url":"?subject=S&P Global and ISM service sector surveys compared | S&P Global &body=http%3a%2f%2fwww.spglobal.com%2fmarketintelligence%2fen%2fmi%2fresearch-analysis%2fsp-global-and-ism-service-sector-surveys-compared.html","enabled":true},{"name":"whatsapp","url":"https://api.whatsapp.com/send?text=S%26P+Global+and+ISM+service+sector+surveys+compared+%7c+S%26P+Global+ http%3a%2f%2fwww.spglobal.com%2fmarketintelligence%2fen%2fmi%2fresearch-analysis%2fsp-global-and-ism-service-sector-surveys-compared.html","enabled":true}]}, {"name":"rtt","enabled":true,"mobdesc":"Top"}
]}


