Customer Logins
Obtain the data you need to make the most informed decisions by accessing our extensive portfolio of information, analytics, and expertise. Sign in to the product or service center of your choice.
Customer Logins
BLOG
Jun 18, 2018
'Short burn' spares few
- Crowded US equity shorts up 5.4% in June vs 1.8% market average
- June on pace to be 4th consecutive month of crowded short outperformance
- Shorts sellers cover crowded positions, but see opportunities elsewhere
"Oh and uh short burn of the century coming soon. Flamethrowers should arrive just in time," so tweeted Elon Musk on May 4th, following the Q1 earnings call. Well, the flamethrowers arrived last week, as did the short burn, which has spared few of the most shorted US equities.
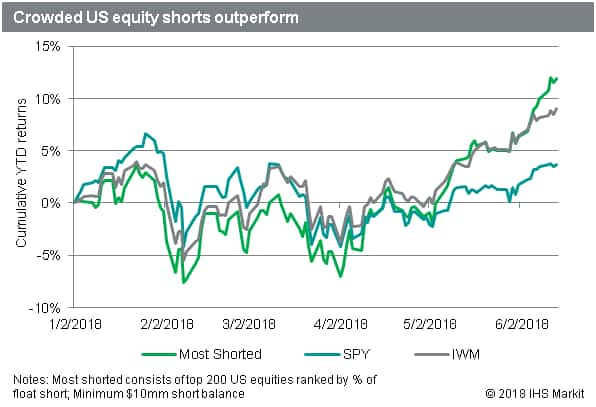
Since the start of June, the most shorted stocks, measured as a percentage of float short, have dramatically outperformed the broader market, having traded in lockstep with small capitalization stocks throughout May. Over the last two weeks the 200 most shorted US equities have returned an average of 5.4%, compared with 2.4% for the Russell 2000 and 1.8% for the S&P 500.

Even when expanding to compare stocks with above median short percentage, the stocks with higher short interest returned 2.4% vs 1.2% return for stocks below the median. But is it a short squeeze?
Russell 2000 Performance
Shares of 200 most shorted Russell 2000 stocks, ranked by short interest as a percentage of float, have increased in value by 6% on average, compared with a 2% average for all index constituents. Of those 200 highly shorted stocks, there were 28 stocks whose price has increased more than 15% since the start of June. In that group there was a decline in shares short of 4% on average, suggesting that short covering is indeed putting some upward pressure on the highly shorted stocks which are outperforming. Normalizing for the impact of price changes, short sellers have reduced positions in those 28 positive-momentum crowded Russell shorts by $330m in the last two weeks. Despite the short covering, the total short position in those stocks, in dollar terms, increased by over $1bn. In that group Overstock.com is currently ranked as having the greatest risk of a short squeeze, per IHS Markit's Research Signals Short Squeeze model.

The 200 best performing stocks in the Russell 2000 had a 5% increase in shares short on average, suggesting that short sellers are not covering all names with positive momentum. Some of the highly shorted stocks with increasing prices and short positions include Dinequity, Therapeuticsmd, Impinj Inc and iRobot.

Overall, the Russell 2000 constituents have seen an increase of 16m shares short since the start of June, for an overall increase in balances greater than $5bn. Normalizing for the impact of price changes, the increase in shares would have added $1.5bn in new shorts even if prices had remained the same. The covering in crowded shorts, contrasted with an overall increase in short positions, suggests that short sellers are doing more to allocate short exposure away from squeeze risk rather than reducing general exposure on the short side.
S&P 500 Performance
Short sellers have also retreated from crowded shorts in the S&P 500. In the top 100 S&P shorts, ranked by short percent of float, the shares short declined by 2% on average during the first two weeks of June, compared with an increase of 3% for all S&P stocks. The S&P names with high short interest have also outperformed, with the share price of the 100 most shorted constituents increasing 2.4% since the start of June versus an average of 1.8% for all constituents. The 23 S&P names in the top 100 most shorted, whose share price increased by at least 5% since the start of June, had a 2% decline in shares short on average. Taken together there appears to be less evidence of short covering leading the large cap rally than observed for crowded small cap shorts.

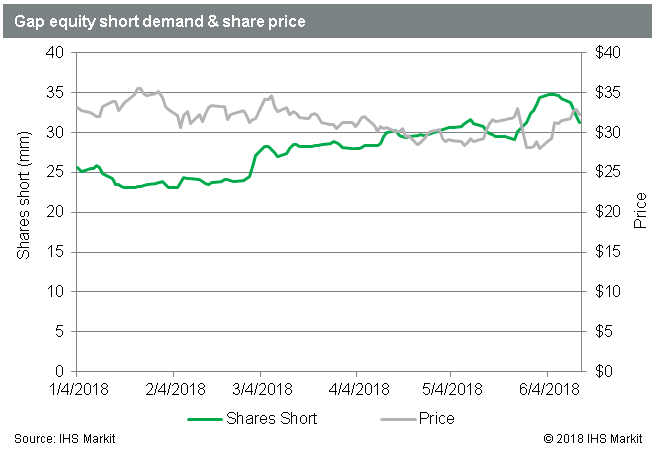
Sempra Energy, Harley Davidson and Gap have all seen greater than 10% declines in shares short since the start of June, which was sufficient to reduce the position in dollar terms for each. With the share prices advancing, amid meaningful reductions in short positions, it's fair to say they fall into the camp of stocks where short covering likely had an impact on the recent rally.

Of the crowded S&P 500 stocks, short sellers have increased positions in CF Industries, Discovery, Kroger and Mattel, despite increasing share prices.

Tesla Performance
Bringing it back to the quote at the outset: TSLA, the most shorted US equity at $12.6bn, is up more than 20% since the start of June. In that time short sellers have returned nearly 6m shares, though some portion of that is likely to be delta hedges coming off, while owners of puts continue to watch the premium drain.

Wrap up
Taken together, it is fair to say that the recent "short burn" has indeed affected the most crowded short names, which have outperformed the broader market by a variety of metrics. Despite the pain in certain positions, we've yet to see broad based short covering to the extent that it actually reduces the overall size of short positions in dollar terms.
As the 'Most shorted' chart above illustrates, the recent action is an extension of a trend which has been in place since the start of Q2. For the US market as a whole, the stocks with the highest short interest as a percent of float have outperformed those with lower short interest in March through May and are well on their way to 4th consecutive month in June. The high short interest stocks have also outperformed by an increasing margin each month, per IHS Markit Research Signals. May and June are on pace for the worst consecutive relative returns for short sellers since February and March of 2016, when the most shorted stocks screamed out of the drawdown and outperformed broader indices.
While the rally off the lows in 2016 may be remembered as a short squeeze, and indeed it was for many of the Energy stocks, the overall short position in US equities increased in terms of shares and value from the Feb 12th lows through the end of March. While there was some covering at the end of March of 2016, it wasn't until April when the short covering began in earnest, with the $33bn decline in Q2 2016 balances being, at the time, the largest post-crisis reduction in short balances. That record was later broken in Q4 2016 when short balances declined by $43b. Whether history repeats itself remains to be seen, however in the last 10 years there has only been one other period of four consecutive months where the most shorted US equities outperformed the broader market, and zero such five month runs.
S&P Global provides industry-leading data, software and technology platforms and managed services to tackle some of the most difficult challenges in financial markets. We help our customers better understand complicated markets, reduce risk, operate more efficiently and comply with financial regulation.
This article was published by S&P Global Market Intelligence and not by S&P Global Ratings, which is a separately managed division of S&P Global.
{"items" : [
{"name":"share","enabled":true,"desc":"<strong>Share</strong>","mobdesc":"Share","options":[ {"name":"facebook","url":"https://www.facebook.com/sharer.php?u=http%3a%2f%2fwww.spglobal.com%2fmarketintelligence%2fen%2fmi%2fresearch-analysis%2fshort-burn-spares-few.html","enabled":true},{"name":"twitter","url":"https://twitter.com/intent/tweet?url=http%3a%2f%2fwww.spglobal.com%2fmarketintelligence%2fen%2fmi%2fresearch-analysis%2fshort-burn-spares-few.html&text=%27Short+burn%27+spares+few+%7c+S%26P+Global+","enabled":true},{"name":"linkedin","url":"https://www.linkedin.com/sharing/share-offsite/?url=http%3a%2f%2fwww.spglobal.com%2fmarketintelligence%2fen%2fmi%2fresearch-analysis%2fshort-burn-spares-few.html","enabled":true},{"name":"email","url":"?subject='Short burn' spares few | S&P Global &body=http%3a%2f%2fwww.spglobal.com%2fmarketintelligence%2fen%2fmi%2fresearch-analysis%2fshort-burn-spares-few.html","enabled":true},{"name":"whatsapp","url":"https://api.whatsapp.com/send?text=%27Short+burn%27+spares+few+%7c+S%26P+Global+ http%3a%2f%2fwww.spglobal.com%2fmarketintelligence%2fen%2fmi%2fresearch-analysis%2fshort-burn-spares-few.html","enabled":true}]}, {"name":"rtt","enabled":true,"mobdesc":"Top"}
]}


