Customer Logins
Obtain the data you need to make the most informed decisions by accessing our extensive portfolio of information, analytics, and expertise. Sign in to the product or service center of your choice.
Customer Logins
ECONOMICS COMMENTARY
Nov 26, 2021
PMI surveys: how not to mis-measure manufacturing output
The most common mistake we see in PMI charts is the incorrect use of the headline PMI for manufacturing. The headline PMI is a gauge based on a number of survey sub-indices which is designed to track the overall health of manufacturing. However, often we see this index incorrectly used as a gauge of manufacturing output growth, which can give misleading signals - especially when used to compare manufacturing performance relative to the service sector. Instead, the manufacturing PMI output index needs to be used.
Comparing apples and pears
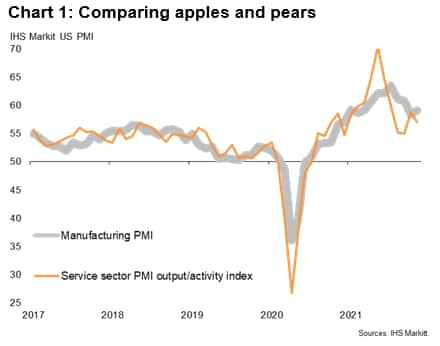
Chart 1 below replicates a widely seen chart based on IHS Markit's PMI data for the US, with similar charts often replicated for other countries. The chart plots the headline manufacturing PMI against the output/activity index for services, intending to provide a guide to how the two sectors are performing relative to each other and how each contribute to changes in economic growth.

Chart 1 suggests that, since early-2021, manufacturing has enjoyed a considerably stronger average rate of expansion than the service sector. However, the opposite is in fact true, as these two series are not directly comparable.
While the service sector output/activity index is based on one survey question asking service providers if their output (or business activity) is higher, the same or lower than one month ago, the manufacturing PMI is a weighted amalgamation of the results of five such questions. Only one of these five questions relates to how manufacturing output has changed relative to the prior month, which therefore provides directly comparable data to the service sector output question. The other four components of the manufacturing PMI relate to new orders, employment, suppliers' delivery times and inventories, which can often show very different trends to output (see below for a more detailed explanation of the rationale behind the manufacturing PMI).
Correct comparisons
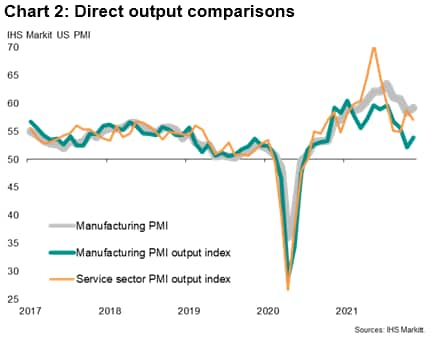
The correct comparison is therefore shown in Chart 2, which replicates chart 1 but also introduces the manufacturing PMI output index as the green line. As this chart reveals, the manufacturing sector has in fact been underperforming services - to a considerable degree - throughout much of 2021 in terms of output growth.

Explaining the divergence
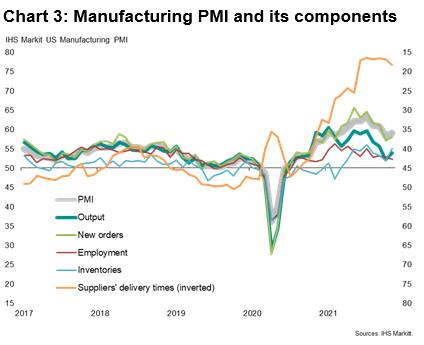
The differing signals from the headline manufacturing PMI and the manufacturing PMI's output index is due to some of the other PMI components varying from the output trend. In the case of 2021, this has been largely the result of extended supplier delivery delays, which have provided a strong lift to the headline PMI (delivery delays are commonly associated with intensifying demand, but in 2021 have been largely the result of the pandemic supply shock). These supply delays have meant that manufacturing output has not been able to expand at a rate commensurate with growth of new orders.

Background to the manufacturing PMI
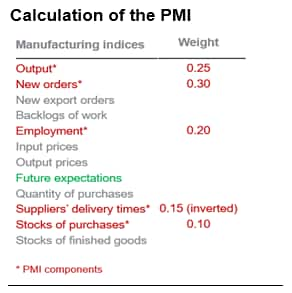
The headline composite PMI was designed as an overall barometer of manufacturing business conditions in the 1980s, bringing together the results of five questions from the NAPM (now ISM) survey of purchasing managers into one single-figure diffusion index. The components with their respective weights are shown below:

Note that not all PMI survey indices are used in the calculation of the PMI (the price indices in particular are excluded). Also note that the suppliers' delivery times index is inverted such that longer delivery times (sub-50 readings) are associated with busier periods of economic activity and vice versa.
The rationale behind the methodology was that those components which tend to lead the business cycle are accorded the highest weight and those which tend to lag are given the lowest weight. Hence the new orders index, which tends to move in advance of other indicators, gets the highest weight. Production is usually quickly altered in response to any significant order book change, hence getting the second-highest weight, and eventually employment levels are also altered. At such times of production capacity growth (or contraction), suppliers also get busier (or less busy), meaning delivery times can lengthen (or shorten), and eventually the altered buying process feeds through to changes in inventories.
As the service sector survey does not include some of the questions asked of manufacturers, such as inventories, a comparable composite PMI is not available for services. These questions are not asked of service sector companies as they are simply not relevant to service providers such as banks, insurance companies, accountancies, professional consultancies and travel agencies to the same extent as they are manufacturing.
Chris Williamson, Chief Business Economist, IHS Markit
Tel: +44 207 260 2329
chris.williamson@ihsmarkit.com
© 2021, IHS Markit Inc. All rights reserved. Reproduction in whole
or in part without permission is prohibited.
Purchasing Managers' Index™ (PMI™) data are compiled by IHS Markit for more than 40 economies worldwide. The monthly data are derived from surveys of senior executives at private sector companies, and are available only via subscription. The PMI dataset features a headline number, which indicates the overall health of an economy, and sub-indices, which provide insights into other key economic drivers such as GDP, inflation, exports, capacity utilization, employment and inventories. The PMI data are used by financial and corporate professionals to better understand where economies and markets are headed, and to uncover opportunities.
This article was published by S&P Global Market Intelligence and not by S&P Global Ratings, which is a separately managed division of S&P Global.
{"items" : [
{"name":"share","enabled":true,"desc":"<strong>Share</strong>","mobdesc":"Share","options":[ {"name":"facebook","url":"https://www.facebook.com/sharer.php?u=http%3a%2f%2fwww.spglobal.com%2fmarketintelligence%2fen%2fmi%2fresearch-analysis%2fpmi-surveys-how-not-to-mismeasure-manufacturing-output.html","enabled":true},{"name":"twitter","url":"https://twitter.com/intent/tweet?url=http%3a%2f%2fwww.spglobal.com%2fmarketintelligence%2fen%2fmi%2fresearch-analysis%2fpmi-surveys-how-not-to-mismeasure-manufacturing-output.html&text=PMI+surveys%3a+how+not+to+mis-measure+manufacturing+output+%7c+S%26P+Global+","enabled":true},{"name":"linkedin","url":"https://www.linkedin.com/sharing/share-offsite/?url=http%3a%2f%2fwww.spglobal.com%2fmarketintelligence%2fen%2fmi%2fresearch-analysis%2fpmi-surveys-how-not-to-mismeasure-manufacturing-output.html","enabled":true},{"name":"email","url":"?subject=PMI surveys: how not to mis-measure manufacturing output | S&P Global &body=http%3a%2f%2fwww.spglobal.com%2fmarketintelligence%2fen%2fmi%2fresearch-analysis%2fpmi-surveys-how-not-to-mismeasure-manufacturing-output.html","enabled":true},{"name":"whatsapp","url":"https://api.whatsapp.com/send?text=PMI+surveys%3a+how+not+to+mis-measure+manufacturing+output+%7c+S%26P+Global+ http%3a%2f%2fwww.spglobal.com%2fmarketintelligence%2fen%2fmi%2fresearch-analysis%2fpmi-surveys-how-not-to-mismeasure-manufacturing-output.html","enabled":true}]}, {"name":"rtt","enabled":true,"mobdesc":"Top"}
]}


