Customer Logins
Obtain the data you need to make the most informed decisions by accessing our extensive portfolio of information, analytics, and expertise. Sign in to the product or service center of your choice.
Customer Logins
ECONOMICS COMMENTARY
Jun 14, 2018
Official production data likely overstate eurozone manufacturing soft patch
- Eurostat data suggest manufacturing has entered its steepest downturn since early-2013
- PMI and EC surveys still in robust expansion territory
- Historical comparisons suggest official data always recover from contraction unless PMI has also fallen into decline
Survey and official data have diverged in terms of the health of the euro area manufacturing sector. An analysis of historical comparisons indicates that the official numbers are likely overstating the extent of recent weakness, and production continues to expand, though all sources suggest the growth trend has cooled.
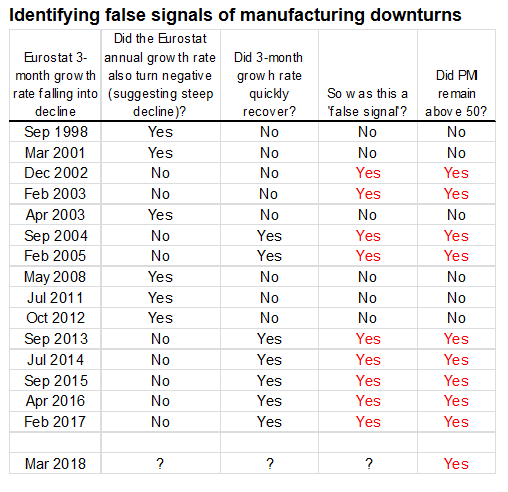
We analyse previous occasions over the past 20 years when the official three-month manufacturing growth rate fell into decline to see whether these were false signals of a downturn trend, and whether the PMI survey could have helped identify such false signals. False signals are defined as a downturn which proved transitory (usually being swiftly reversed as the data rebounded) and failed to translate into a year on year decline in production.
We find that the PMI successfully identified all false signals, and correctly verified all signals of a more entrenched downturn.
Downturn or expansion?
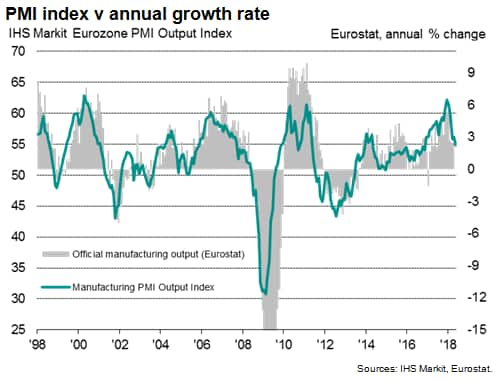
Recent official data from Eurostat indicated a slump in Eurozone manufacturing output, with output dropping 1.6% in the three months to April 2018. This is the steepest three-month rate of decline recorded since early-2013, a time of particular strain in the region's debt crisis.
In contrast, the IHS Markit Eurozone PMI output index has remained in solid expansion territory in recent months. At 54.8 in May, the survey index continued to run well above the 50.0 no-change level, signalling a solid monthly rise in production, having previously sat at 56.2 in April.

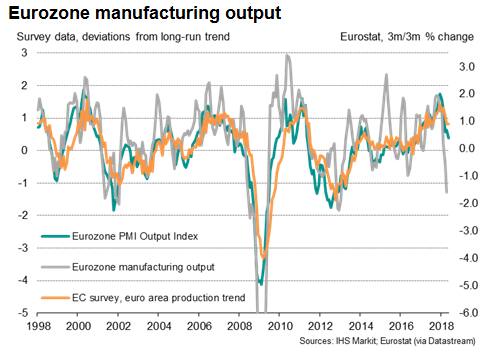
A simple OLS regression analysis indicates that these April and May PMI readings are historically consistent with output growing at a quarterly rate of 1.1% and 0.8% respectively. While down markedly from a lofty 2.8% growth rate signalled in December of last year, the expansions indicated by the recent PMI numbers are clearly strikingly different from the decline registered in the official data.
Looking at data histories, the survey data indicate that the current weakness in the official data will prove temporary. Over the past 20 years, a decline in the three-month rate of change in the official data has only led to the annual growth rate falling into the red only when the PMI has fallen below 50.
Besides the current downturn, there have been 15 occasions since 1998 when the three-month-on-three month rate of change in the Eurostat manufacturing output data has turned negative. However, on nine of these 15 occasions, the downturn was only brief and either followed by a rebound in the official data or reflected pay-back from very strong growth in prior months. Importantly, on all of these nine occasions, the PMI's output index had remained above 50.
On the remaining six occasions, the downturn in the three-month growth rate was accompanied (or soon followed) by the annual rate of growth also falling into decline, signalling a more worrying downturn. Notably, on all of these six occasions, the PMI had also fallen below 50.
Decline only temporary if PMI above 50
The message from the historical comparisons is therefore that a downturn in the official three-month growth rate will prove transitory unless the PMI has also fallen below 50.
In the current circumstances, the PMI index remains well above 50 to suggest the official data will soon return to positive territory.
The current divergence may be explained by special factors: February and March both saw extreme weather hit some parts of the region, and strikes were also reported to have disrupted business in some countries. The timing of Easter is also likely to have caused changes to normal seasonal patterns. More recently, a higher than usual number of public holidays (in some cases bridged over to the weekend) may have led to a greater than usual dampening of business activity in May. It's possible that some survey respondents have made allowances for such special factors, instead reporting on the underlying trend in business. As such, the survey data would send a more positive signal than official data.
Such a signal of steady growth so far in the second quarter is also being sent by the EC survey (see chart). However, both the PMI and EC surveys have lost ground in recent months from peaks at the turn of the year, indicating that growth has slowed.

Output growing faster than orders
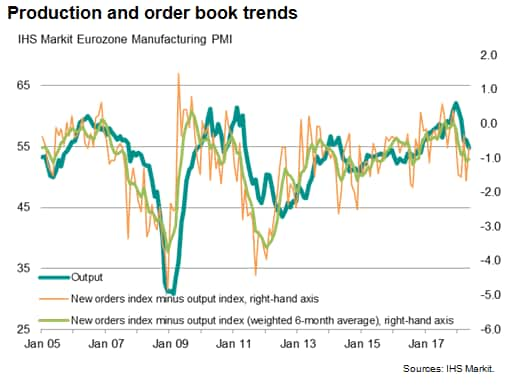
However, while investors should therefore be reassured that the official data likely overstated the weakness of manufacturing so far this year, and may rebound in coming months, this rebound could in turn prove a false signal of health. Whereas new order growth was broadly in line with that of output throughout much of last year according to the PMI, output has now been growing at a faster rate than new orders in each of the past six months, auguring for further weak production in coming months unless demand revives.


Chris Williamson, Chief Business Economist, IHS Markit
Tel: +44 207 260 2329
chris.williamson@ihsmarkit.com
Purchasing Managers' Index™ (PMI™) data are compiled by IHS Markit for more than 40 economies worldwide. The monthly data are derived from surveys of senior executives at private sector companies, and are available only via subscription. The PMI dataset features a headline number, which indicates the overall health of an economy, and sub-indices, which provide insights into other key economic drivers such as GDP, inflation, exports, capacity utilization, employment and inventories. The PMI data are used by financial and corporate professionals to better understand where economies and markets are headed, and to uncover opportunities.
Learn how to access and receive PMI data
© 2018, IHS Markit Inc. All rights reserved. Reproduction in whole or in part without permission is prohibited.
{"items" : [
{"name":"share","enabled":true,"desc":"<strong>Share</strong>","mobdesc":"Share","options":[ {"name":"facebook","url":"https://www.facebook.com/sharer.php?u=http%3a%2f%2fwww.spglobal.com%2fmarketintelligence%2fen%2fmi%2fresearch-analysis%2fofficial-production-data-likely-overstate-eurozone-manufacturing-soft-patch.html","enabled":true},{"name":"twitter","url":"https://twitter.com/intent/tweet?url=http%3a%2f%2fwww.spglobal.com%2fmarketintelligence%2fen%2fmi%2fresearch-analysis%2fofficial-production-data-likely-overstate-eurozone-manufacturing-soft-patch.html&text=Official+production+data+likely+overstate+eurozone+manufacturing+soft+patch+%7c+S%26P+Global+","enabled":true},{"name":"linkedin","url":"https://www.linkedin.com/sharing/share-offsite/?url=http%3a%2f%2fwww.spglobal.com%2fmarketintelligence%2fen%2fmi%2fresearch-analysis%2fofficial-production-data-likely-overstate-eurozone-manufacturing-soft-patch.html","enabled":true},{"name":"email","url":"?subject=Official production data likely overstate eurozone manufacturing soft patch | S&P Global &body=http%3a%2f%2fwww.spglobal.com%2fmarketintelligence%2fen%2fmi%2fresearch-analysis%2fofficial-production-data-likely-overstate-eurozone-manufacturing-soft-patch.html","enabled":true},{"name":"whatsapp","url":"https://api.whatsapp.com/send?text=Official+production+data+likely+overstate+eurozone+manufacturing+soft+patch+%7c+S%26P+Global+ http%3a%2f%2fwww.spglobal.com%2fmarketintelligence%2fen%2fmi%2fresearch-analysis%2fofficial-production-data-likely-overstate-eurozone-manufacturing-soft-patch.html","enabled":true}]}, {"name":"rtt","enabled":true,"mobdesc":"Top"}
]}


