New PMI data signal outperformance of Queensland since COVID-19 outbreak
Detailed Australia PMI data provided for three states: Victoria, New South Wales and Queensland
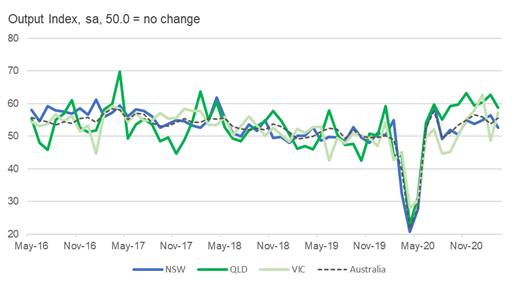
Output growth consistently stronger in Queensland since middle of 2020
Victoria and NSW hit by subsequent lockdowns and weaker services activity growth
IHS Markit's Australia PMI data have recently been expanded in order to delve more deeply into the regional and sectoral trends affecting business conditions across the manufacturing and services industries. In this article we present our analysis of PMI data covering three key Australian states: Victoria, New South Wales and Queensland. This complements initial findings from our recent research into how different sectors are performing, presented here.
To conduct this state-level analysis, we have divided the survey responses conducted across the country's manufacturing and services panels into their respective geographic locations. Based on the resulting sample sizes, we are able to generate diffusion indices for the three most populous states in Australia, including all indicators normally found in our composite-level analysis.
This method allows us to compare each state's monthly business performance and offer insights into growth trends and particularly the impact of the coronavirus disease 2019 (COVID-19) pandemic.
Queensland records stronger growth in output and new business
In March 2020, Australia joined much of the world in enacting strict lockdown rules in order to contain the spread of COVID-19, resulting in an unprecedented economic downturn, as reflected in a sharp fall in the Australia PMI's Composite Output Index. With the first wave of cases proving small in comparison to other countries, restrictions were eased, and the index returned to growth territory last June, with subsequent measures becoming more varied at a state level.
Of the three states monitored in this analysis, Queensland has seen a consistently stronger rate of output growth since the second half of 2020. The Composite PMI Output Index has averaged 59.8 from July 2020 to March 2021, compared to averages of just 53.7 in New South Wales and 52.7 in Victoria.
Manufacturing and services data show that Queensland has excelled in both of these broad sectors during this period, although there was a greater outperformance among service providers. This could largely by explained by the number of COVID-19 cases by region: Queensland has only seen roughly 1,500 cases to date, compared to 20,000 in Victoria and 5,000 in New South Wales. As a result, service sector businesses in Queensland have enjoyed relatively more relaxed virus containment and social distancing measures, and have hence been able to recover more quickly from the initial downturn in April and May 2020.
By contrast, Victoria saw a second wave of COVID-19 cases during the third quarter of 2020, leading to further social distancing restrictions and the closure of its border with New South Wales. Output fell sharply, albeit not as steeply as seen in the previous quarter. A snap lockdown in early-2021 also resulted in a further fall in activity, according to February data.
New South Wales has seen a more consistent recovery in output than in Victoria, with growth running close to the nationwide trend since the middle of 2020, and both the manufacturing and service sectors recording a stronger performance. In comparison to Queensland, however, average services growth was notably softer, with restrictions on hospitality capacity and inter-state travel noted as contributing factors. The state also experienced a short lockdown in December due to an outbreak of cases in Sydney.
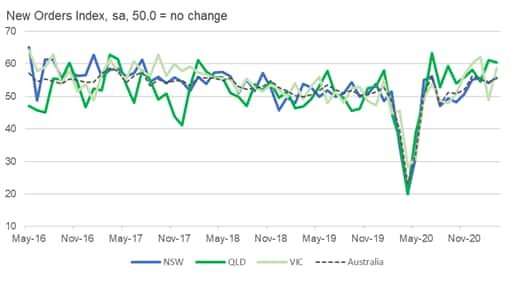
New orders PMI data highlight how the relative strength of output growth in Queensland was supported by a sharper rise in new business inflows compared to Victoria and New South Wales since the middle of last year. In all but one of the last nine months, private sector sales in Queensland have increased to a greater extent than that seen across Australia. This outperformance was driven by the services sector, while manufacturing new order growth was in fact weaker in Queensland than in Victoria during this period.
States see similar job market trends
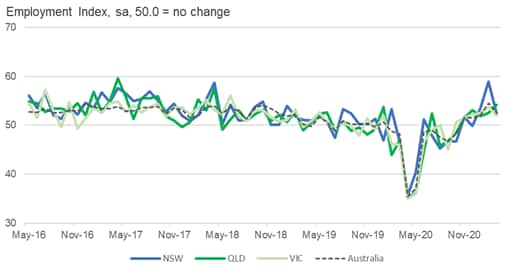
Composite PMI Employment Indices meanwhile signal that job markets across the three monitored Australian states have been broadly similar since last July, despite the output variations.
Whilst Queensland enjoyed a stronger recovery in both output and new business, the average level of employment growth over the past nine months matched that seen in Victoria and was only slightly faster compared to New South Wales.
Moreover, job numbers have only consistently risen in each of the last five months in Queensland, Victoria (and nationwide), in line with a notable pick up in demand growth across the country. In the former, outstanding business levels only began to rise from February, suggesting that capacity pressures have only recently contributed to hiring activity.
Broad-based price increases
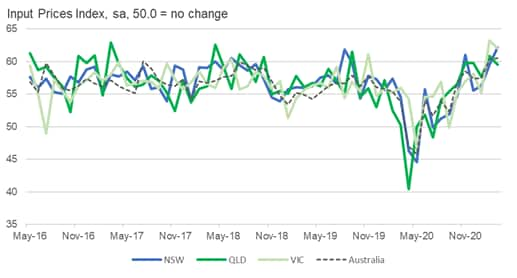
The PMI data also suggests that the recent quickening of input price inflation in Australia has been widespread, with panellists linking the increase in costs to higher raw material prices and wages. Notably, New South Wales recorded the fastest rate of inflation since the survey began in 2016 during March (as did Australia as a whole), and Victoria posted its record high in February.
In a time where state-level COVID-19 restrictions are still changing and reacting to virus outbreaks, these monthly data are crucial to providing insights into regional economic trends and help businesses make sense of the impact of the pandemic.
David Owen, Economist, IHS Markit
Tel: +44 2070 646 237
david.owen@ihsmarkit.com
© 2021, IHS Markit Inc. All rights reserved. Reproduction in whole
or in part without permission is prohibited.
Purchasing Managers' Index™ (PMI™) data are compiled by IHS Markit for more than 40 economies worldwide. The monthly data are derived from surveys of senior executives at private sector companies, and are available only via subscription. The PMI dataset features a headline number, which indicates the overall health of an economy, and sub-indices, which provide insights into other key economic drivers such as GDP, inflation, exports, capacity utilization, employment and inventories. The PMI data are used by financial and corporate professionals to better understand where economies and markets are headed, and to uncover opportunities.
This article was published by S&P Global Market Intelligence and not by S&P Global Ratings, which is a separately managed division of S&P Global.


