Customer Logins
Obtain the data you need to make the most informed decisions by accessing our extensive portfolio of information, analytics, and expertise. Sign in to the product or service center of your choice.
Customer Logins
BLOG
Jul 15, 2020
Monthly trade monitor for the top 10 economies in the world - July 2020
Main observations
- With more trade data reported by the top 10 economies in the world we can say more about the evolution of trade in Q2 2020
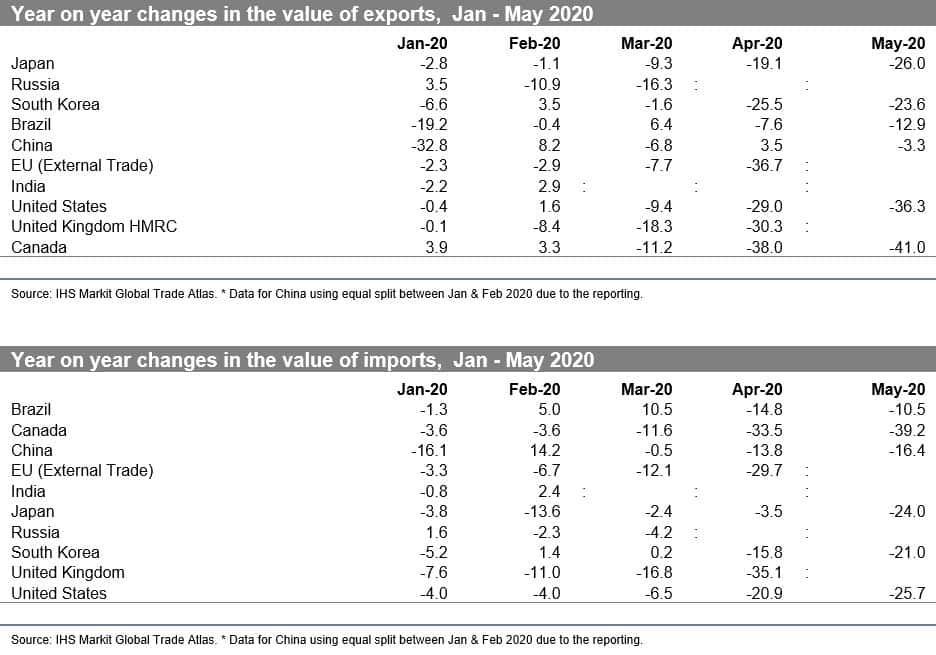
- April 2020 brought about a massive collapse in the value of exports (year-on-year) with exports falling from 7.6% in Brazil, 19.1% in Japan and 25.5% in South Korea, to 29.0% in the US, 30.3% in the UK, 36.7% in the EU and by 38.0% in Canada (the worst affected country), the only major economy to note an increase in the value of exports was China (+3.5%), for imports, all the major economies reported a significant decrease year-on-year ranging from -3.5% in Japan and -13.5% in China to a massive drop of 33.5% in Canada and -35.1% in the UK suggesting significantly lower demand for imports in the pandemic-affected countries
- The Western hemisphere countries (EU, the UK, the US, and Canada) seem at this stage to be more adversely affected than other economies, however, in line with the delayed pandemic curve in Brazil the situation in this South American economy is deteriorating
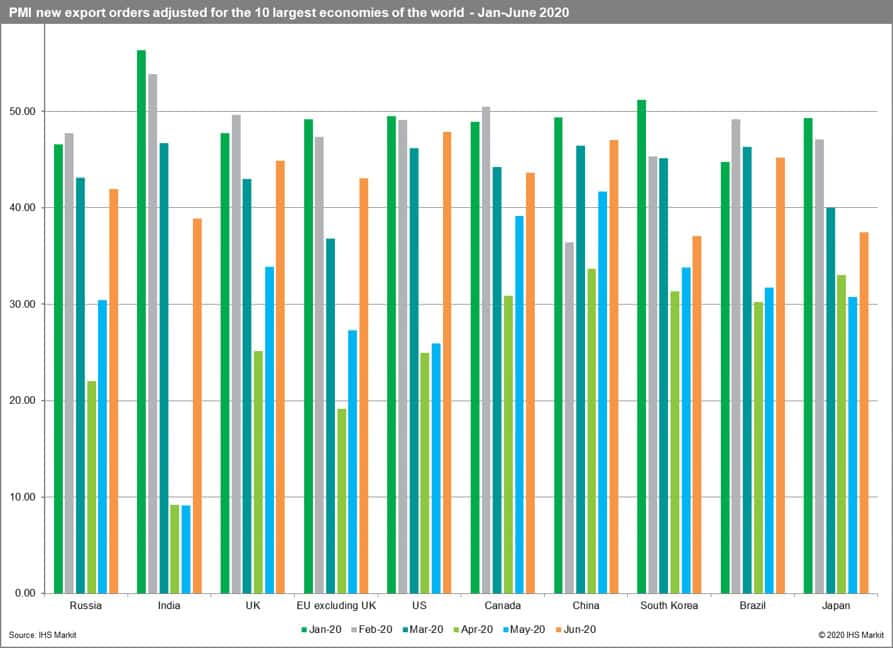
- The PMI new exports orders readouts for May were significantly below of the benchmark value of 50.0 points suggesting a contraction in the forthcoming months
- Year-on-year changes in exports in May 2020 are negative for all reporting states including China (-3.3%), Brazil (-12.9%), South Korea (-23.6%), Japan (-26.0%), US (-36.3%) and Canada (-41.0%), in line with the expectations May 2020 brought about a deterioration of the situation in most of the states (apart from South Korea) with the most adverse shifts in comparison to April 2020 in the US, Japan, and China
- Year-on-year changes in imports in May 2020 similarly to exports are negative for all reporting states and range from -10.5% in Brazil and - 16.4% in China to -25.7% in the US and -39.2% in the case of Canada, in comparison to April 2020 the situation deteriorated in all the states apart from Brazil with Japan being affected the most

- The outbreak of COVID-19 proves to be the largest black-swan in a century with a tremendous impact on the global economy; unless the situation improves in the second part of the year we will be dealing with the largest contraction of global trade since the Second World War far larger than the effects of the global financial crisis in 2008-09
- Q2 2020 is for sure worse than Q1 2020 in terms of the developments in trade and potentially the worst quarter in trade statistics so far
Prospects for the forthcoming months
- As has been already stressed in the preceding months, the reaction in trade is consistent with the escalating global COVID-19 pandemic and steps taken by individual countries (or group of countries) in controlling or mitigating it
- The impact on global trade will depend on the duration, severity and the spatial distribution of the pandemic with several scenarios of recovery still possible
- Unfortunately, the threat of the second wave of the pandemic is increasing with some states already re-imposing strict overall or partial (regional) lockdowns (e.g. Israel, Melbourne metropolitan area in Australia) and some countries still unable to deal efficiently with the first wave, the potential second wave in autumn 2020 could have drastic consequences for the global economy postponing the expected recovery to next year
- The prospects for the forthcoming months (before autumn) are a bit more optimistic, the values of PMI manufacturing new export orders adjusted for June 2020 are still below the benchmark value of 50.0 pointing to a contraction, however, they significantly improved in comparison to April and May 2020 readouts, thus we can still expect a decline in exports by the top 10 economies year-on-year but to a smaller extent than in the preceding months
- The index in June 2020 takes the lowest value for South Korea, Japan and India (below 40.0 points), the readout for the US economy is above of the value for China, the trend in the PMI allows for some optimism, with the readouts potentially above 50.0 points for some of the economies in July 2020 that could be an early sign of gradual recovery in Q3 2020
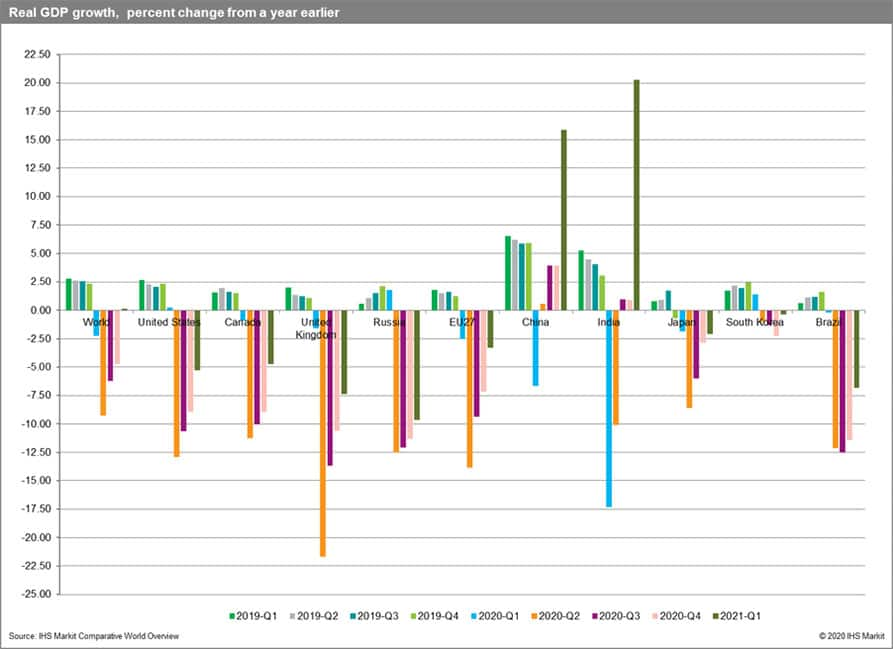
- The most recent GDP growth forecasts from IHS Markit Comparative World Overview (published on 15 June 2020) point to a recession in most of the states throughout 2020 apart from China mainland (recovery in Q2) and India (recovery in Q3 2020). The worst affected countries (regions) in Q2 2020 are forecasted to be the UK, EU, and the US
- The recession is forecasted to last to Q1 2021 in most of the states with a significant upturn in the case of China and India only (consistently with the forecasts for the remainder of this year), stronger recovery in real GDP growth rates is expected to spread to other economies only later in 2021, the forecast, unfortunately, depends critically on the ability to deal with the potential second/third waves of the pandemic, uncertainty levels are still high
- Taking into account the multiplier effect between GDP growth and trade growth in times of crisis exceeding the value of 3.0 we can expect the contraction of trade in most of the states to last through 2020 and to take more than two-digit values year-on-year, the contraction in trade in Q2 2020 could be deeper than we forecasted in the last release of the GTA Forecasting models; the new data reported by countries for Q2 2020 will be taken into account in the forthcoming release of the forecast in August


Main economies of the world and methodological issues
- Top 10 economies by GDP in 2019 include: the US, EU (excluding the UK), China, Japan, the UK, India, Brazil, South Korea, Canada, and Russia
- They were responsible for 79% of the world GDP in 2019 and 73% of global exports with most trade carried out within the group itself
- We present year-on-year changes in the value of exports and imports for available monthly trade data from GTA for the period from March 2018 to May 2020 in percent
- Data edge differs from country to country depending on a given reporter
- For the EU Member states we take into account only EU external trade that is with non-EU states
- Russia and India have not, as for now, reported trade data for Q2 2020
- China reported an aggregated value of trade for January-February 2020 - the data in the GTA database was equally split between the two months
{"items" : [
{"name":"share","enabled":true,"desc":"<strong>Share</strong>","mobdesc":"Share","options":[ {"name":"facebook","url":"https://www.facebook.com/sharer.php?u=http%3a%2f%2fwww.spglobal.com%2fmarketintelligence%2fen%2fmi%2fresearch-analysis%2fmonthly-trade-monitor-for-top-10-economies-in-the-world-july.html","enabled":true},{"name":"twitter","url":"https://twitter.com/intent/tweet?url=http%3a%2f%2fwww.spglobal.com%2fmarketintelligence%2fen%2fmi%2fresearch-analysis%2fmonthly-trade-monitor-for-top-10-economies-in-the-world-july.html&text=Monthly+trade+monitor+for+the+top+10+economies+in+the+world+-+July+2020++%7c+S%26P+Global+","enabled":true},{"name":"linkedin","url":"https://www.linkedin.com/sharing/share-offsite/?url=http%3a%2f%2fwww.spglobal.com%2fmarketintelligence%2fen%2fmi%2fresearch-analysis%2fmonthly-trade-monitor-for-top-10-economies-in-the-world-july.html","enabled":true},{"name":"email","url":"?subject=Monthly trade monitor for the top 10 economies in the world - July 2020 | S&P Global &body=http%3a%2f%2fwww.spglobal.com%2fmarketintelligence%2fen%2fmi%2fresearch-analysis%2fmonthly-trade-monitor-for-top-10-economies-in-the-world-july.html","enabled":true},{"name":"whatsapp","url":"https://api.whatsapp.com/send?text=Monthly+trade+monitor+for+the+top+10+economies+in+the+world+-+July+2020++%7c+S%26P+Global+ http%3a%2f%2fwww.spglobal.com%2fmarketintelligence%2fen%2fmi%2fresearch-analysis%2fmonthly-trade-monitor-for-top-10-economies-in-the-world-july.html","enabled":true}]}, {"name":"rtt","enabled":true,"mobdesc":"Top"}
]}


