Customer Logins
Obtain the data you need to make the most informed decisions by accessing our extensive portfolio of information, analytics, and expertise. Sign in to the product or service center of your choice.
Customer Logins
BLOG
Jan 14, 2019
IBORs, new benchmarks series - Focus on SOFR
It is chilly out there… Not a bad time to look at what happened on IBORs, new benchmarks and SOFR recently. If you missed our previous articles on this topic, you can find them here:
SOFR and alternative RFRs - An introduction
SOFR and alternative RFRs - Market update
SOFR, what happened this fall?
Since our last update published late summer, a lot
happened in the SOFR space. We have seen a nice uptick in issuances
with more players involved, taking the total outstanding SOFR debt
to $43.8 billion at the time of writing. SOFR futures volumes are
increasing at a good pace and we are seeing slightly more SOFR
swaps and basis swaps.
There is still a long way to go and consultations addressing
fallback language, protocols and pricing conventions are going to
be very important if we want to see further SOFR market expansion
in 2019. The ARRC, LSTA and ISDA have been driving major
initiatives in that space. On December 20th, ISDA published the
results of their Benchmark Fallbacks Consultation, providing
clarity to derivatives market participants on what to do in the
event an IBOR is permanently discontinued. Additional feedback from
market participants will be sought by ISDA before fallbacks can be
implemented in its standard definitions later in 2019.
Primary market, more players involved
Following the first-ever issuance of a SOFR-linked
note by Fannie Mae on July 26th, more market participants have
decided to transition some of their debt to the new benchmark.
Volumes in that space are still relatively low and more regular
issuance programs will be needed to support liquidity in the
primary market.
We have selected some significant deals from late 2018:
- 20th September, New York's Metropolitan Transportation Authority (MTA) issued a $107.3 million 1-yr SOFR note with a rate of 67% of SOFR + 43 bps
- 24th October, Toyota Motor Credit Corporation issued a $500 million SOFR note
- 31st October, Fannie Mae issued another $5bn of SOFR-linked notes, taking their total outstanding to $11 billion
- 15th November, Federal Home Loan Banks (FHLB) issued a $4
billion 1-yr SOFR note with 2 tranches:
- 6-month $1.5 billion at SOFR + 4 bps
- 12-month $2.5 billion at SOFR + 6.5 bps
FHLB has since then issued another $10.3 billion of debt tied to SOFR, bringing its outstanding notional to $14.3 billion (32% market share!) - 28th November, European Investment Bank (EIB) issued a $1
billion 3-yr SOFR note:
- Quarterly compounded coupon of SOFR + 32bps
- First note to use SOFR compounding rather than weighted average over the relevant period - 19th December, Freddie Mac issued a $2 billion 6-month SOFR note adding to its inaugural $1 billion issuance early November. Adding 3 new issuances early January takes the total SOFR debt issued by Freddie Mac to $5.1 billion.
CME Group is maintaining a (very handy) list of all SOFR-linked issuances on their website. As of 17th January 2019, the top 3 issuers - namely FHLB, Fannie Mae and Freddie Mac account for 69% of the outstanding total ($43.8 billion). However, the number of players involved in that space keeps increasing which is testament that SOFR is gaining traction in the primary market.
Secondary market, futures volumes are up but swaps
still limited
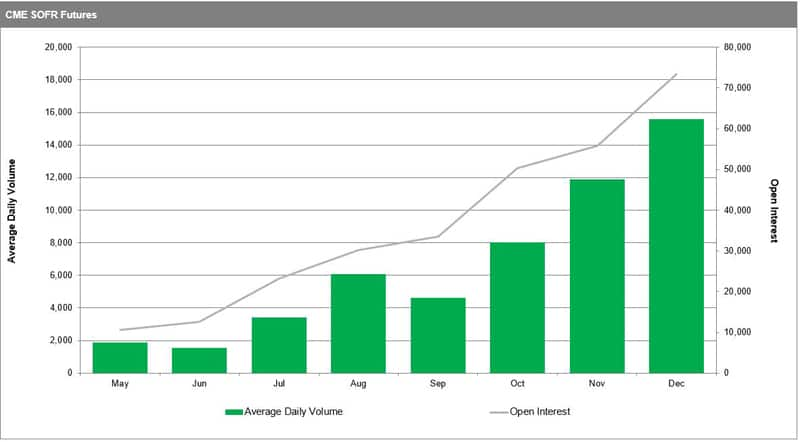
Since their launch in May 2018, SOFR futures have
enjoyed a nice ride and daily volumes have reached 15,000 contracts
on average in December 2018.
 Source: cmegroup.com
We discussed SOFR swaps and basis swaps in our previous updates. Although volumes are still very low, October and November saw a significant increase in the number of swaps traded. SOFR swaps trading dipped again in December but this is likely explained by seasonality. 1y and 2y maturities are by far the most popular tenors and we have now seen a few 3y trades.
It will be interesting to see how these markets develop in early 2019 now that some clarity has been provided by ISDA. We may not see a major pick up before Q3 as ISDA is expected to launch a supplemental consultation in early 2019 to gather feedback regarding USD LIBOR which was not specifically covered by its recent benchmark consultation.
Case study, end-of-year spike
On December 31st, it was reported that the cost of
borrowing overnight cash in the US Treasury repo market hit an
intraday high of 7.25%. The General Collateral (GC) repo rate
closed at 4.00%, up 107bps on the day.
End-of-year spikes (also called turn effect) are commonplace in the
market but this year the US government's decision to issue $51
billion of debt on the last trading day of the year seems to have
taken some firms by surprise. This translated into a largely
increased cost of funding in the overnight repo market on that
day.
SOFR is a transaction-based benchmark and covers a broad range of
repos transactions. As a reminder:
- Tri-party General Collateral Rate (TGCR): based on trade level tri-party data
- Broad General Collateral Rate (BGCR): TGCR + GCF repos
- Secured Overnight Financing Rate (SOFR) = BGCR + FICC-cleared bilateral repos
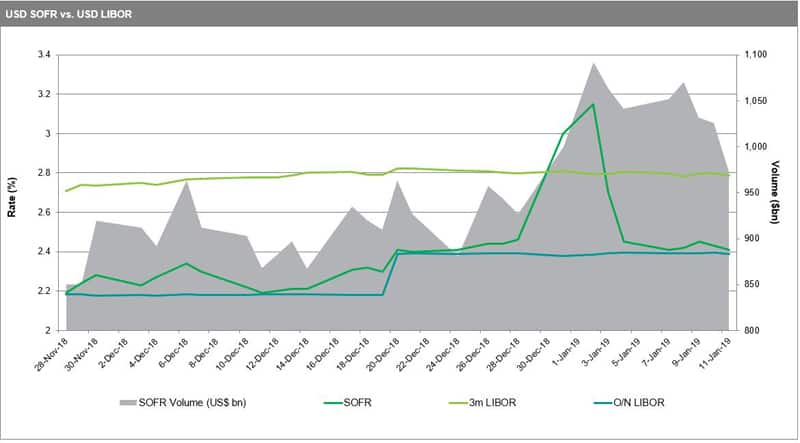
One would expect to see the same end-of-year spike to show on the SOFR rate published by the FED on that day. And it did show indeed! As per the graph below, SOFR spiked more than 50 bps over a couple of days at year-end before returning to its previous range of 2.40-2.50%. Interestingly, the FED also discloses percentiles on its website and we can see that the 99th percentile of valid repo transactions used in the SOFR calculation was 6.25% on December 31st, very close to the reported intraday high of 7.25%.
As expected - and for better or worse - SOFR is substantially more responsive to market events than LIBOR. If the industry is going to use this new benchmark, SOFR daily volatility is something that all participants will have to embed in their pricing and modelling assumptions in the future.
 Source (data):
newyorkfed.org
For more information and to be notified of new content on IBORs new benchmarks, please contact Julien Rey, Director for Totem Interest Rates America, IHS Markit at julien.rey@ihsmarkit.com.
{"items" : [
{"name":"share","enabled":true,"desc":"<strong>Share</strong>","mobdesc":"Share","options":[ {"name":"facebook","url":"https://www.facebook.com/sharer.php?u=http%3a%2f%2fwww.spglobal.com%2fmarketintelligence%2fen%2fmi%2fresearch-analysis%2fibors-new-benchmarks-series-focus-on-sofr.html","enabled":true},{"name":"twitter","url":"https://twitter.com/intent/tweet?url=http%3a%2f%2fwww.spglobal.com%2fmarketintelligence%2fen%2fmi%2fresearch-analysis%2fibors-new-benchmarks-series-focus-on-sofr.html&text=IBORs%2c+new+benchmarks+series+-+Focus+on+SOFR+%7c+S%26P+Global+","enabled":true},{"name":"linkedin","url":"https://www.linkedin.com/sharing/share-offsite/?url=http%3a%2f%2fwww.spglobal.com%2fmarketintelligence%2fen%2fmi%2fresearch-analysis%2fibors-new-benchmarks-series-focus-on-sofr.html","enabled":true},{"name":"email","url":"?subject=IBORs, new benchmarks series - Focus on SOFR | S&P Global &body=http%3a%2f%2fwww.spglobal.com%2fmarketintelligence%2fen%2fmi%2fresearch-analysis%2fibors-new-benchmarks-series-focus-on-sofr.html","enabled":true},{"name":"whatsapp","url":"https://api.whatsapp.com/send?text=IBORs%2c+new+benchmarks+series+-+Focus+on+SOFR+%7c+S%26P+Global+ http%3a%2f%2fwww.spglobal.com%2fmarketintelligence%2fen%2fmi%2fresearch-analysis%2fibors-new-benchmarks-series-focus-on-sofr.html","enabled":true}]}, {"name":"rtt","enabled":true,"mobdesc":"Top"}
]}


