Global inflation set to lift higher according to PMI surveys: five key charts
A 13-year record rise in prices signalled by IHS Markit's worldwide manufacturing and services PMI surveys in October points to a further acceleration of global consumer price inflation, with the strongest rate of increase indicated for the United States.
IHS Markit's PMI surveys track input costs at manufacturing and service sector companies around the world, as well as the average prices charged for these goods and services. The surveys also monitor supplier delivery times, which provide a unique insight into the extent to which supply delays are feeding higher prices.
The latest data from the October PMIs were far from comforting, as illustrated by five key charts:
Chart 1: Supply delays push costs higher
In the first instance, already-widespread supplier delays became even more common during October. The incidence of delays and shortages surpassed anything seen in almost a quarter century of survey data history. These shortages fed through to yet another increase in firms' costs, which rose across manufacturing and services in October at the fastest rate seen for 13 years. Only during the oil price spike of 2008 have higher cost pressures been faced by businesses worldwide.
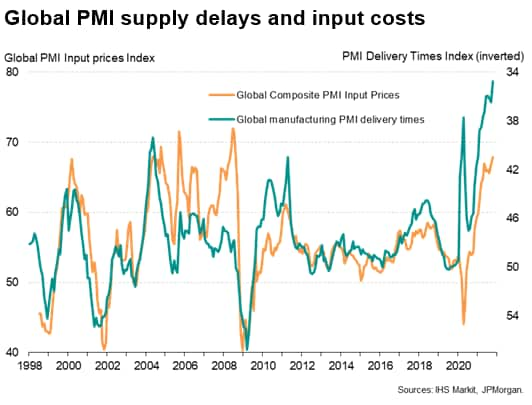
Chart 2: Higher costs passed on to customers
These costs are being passed on to customers at rates unprecedented in the PMI survey history. The Global PMI's selling price index hit an all-time high of 60.3 with record highs seen for both goods and services. These indices were first compiled in 2009.
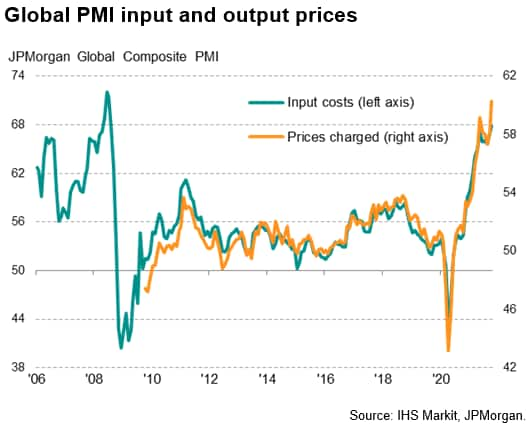
Chart 3: Consumers hit by higher prices
While the steepest rate of selling price inflation was recorded globally for intermediate goods (i.e. components sold to other companies), selling prices for consumer goods and investment goods (such as machinery) also rose at the steepest rates recorded since comparable data were available in 2009.
Rising costs also fed through to higher charges levied for all major types of service, with business services reporting the third-highest increase on record and an all-time high reached for consumer services. Prices charged for financial services meanwhile showed the second-highest price rise on record, linked in part to higher borrowing costs.
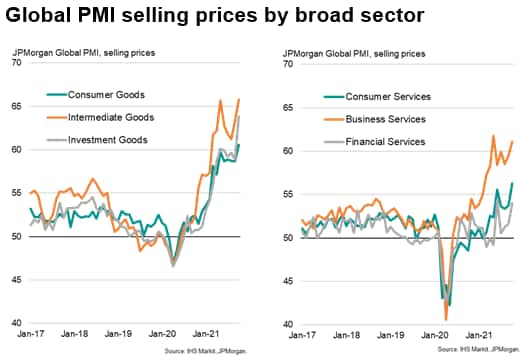
Chart 4: Business costs to feed through to CPI
Note that, over the past 14 years, the PMI input cost index has exhibited a 79% correlation with global consumer price inflation, with the PMI acting with a lead of three months. With the latest official data showing consumer prices rising globally at an annual rate of 4.3%, its highest for a decade, the PMI suggests this could approach 5% in the coming months.
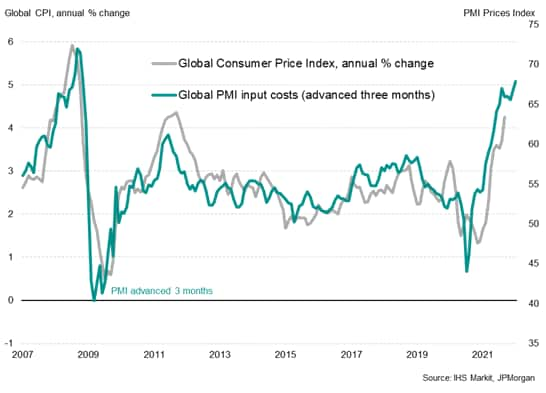
Chart 5: US sees steepest price increase
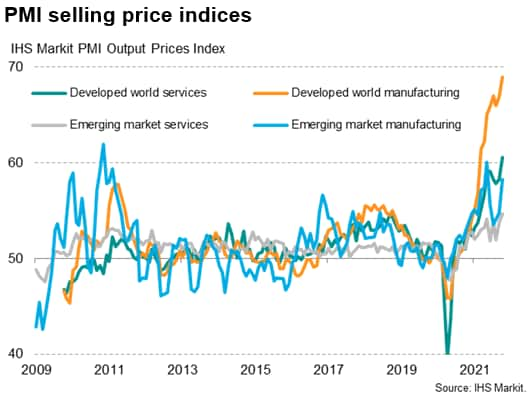
Inflationary pressures were most marked in the developed world, where collectively the PMI surveys indicated by far the steepest increase in average selling prices for goods and services recorded since comparable data were first available in 2009. Goods and services prices both rose at unprecedented rates across the developed markets. However, emerging market selling prices also rose sharply on average, the rate of inflation hitting the second steepest seen over the past decade during October. Charges rose at accelerated rates for both emerging market goods and services, the latter's rate of inflation notably approaching an all-time high.
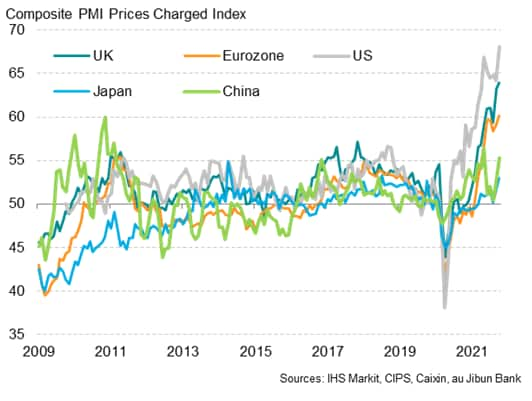
Looking at the major economies, the highest rate of selling price inflation was seen in the US followed by the UK and then the eurozone, all of which saw series record highs for the PMI Output Prices Index covering goods and services. Selling price inflation in Japan meanwhile accelerated to the highest for just over three years and lifted higher in China to the second-highest for over a decade.
Chris Williamson, Chief Business Economist, IHS Markit
Tel: +44 207 260 2329
chris.williamson@ihsmarkit.com
© 2021, IHS Markit Inc. All rights reserved. Reproduction in whole
or in part without permission is prohibited.
Purchasing Managers' Index™ (PMI™) data are compiled by IHS Markit for more than 40 economies worldwide. The monthly data are derived from surveys of senior executives at private sector companies, and are available only via subscription. The PMI dataset features a headline number, which indicates the overall health of an economy, and sub-indices, which provide insights into other key economic drivers such as GDP, inflation, exports, capacity utilization, employment and inventories. The PMI data are used by financial and corporate professionals to better understand where economies and markets are headed, and to uncover opportunities.
This article was published by S&P Global Market Intelligence and not by S&P Global Ratings, which is a separately managed division of S&P Global.
