Customer Logins
Obtain the data you need to make the most informed decisions by accessing our extensive portfolio of information, analytics, and expertise. Sign in to the product or service center of your choice.
Customer Logins
ECONOMICS COMMENTARY
Apr 20, 2018
Comparisons of US manufacturing output ‘soft data’ accuracy
- IHS Markit PMI survey data relating to US manufacturing output outperform the ISM in terms of higher correlation, identifying turning points and suffering from less noise.
- Analysts are therefore encouraged to incorporate IHS Markit data into nowcast and forecast models.
Many US economic nowcast and forecast models use the ISM manufacturing survey data as an input, but statistical analysis suggests IHS Markit's PMI survey may act as a more useful component to such models.
Correlations
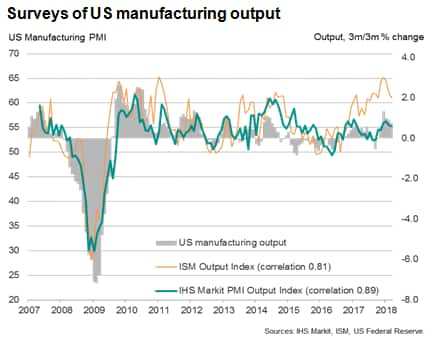
In the first instance, as a 'soft data' advance guide to hard (official) data on manufacturing output, the IHS Markit PMI has outperformed the ISM in recent years. Although the ISM series has a longer history, the data have significantly overstated manufacturing growth since late-2016, resulting in upward bias to many growth models and nowcasts. IHS Markit data, in contrast, have shown no such upward bias and have consequently exhibited a significantly higher correlation with the official data.
Comparing both manufacturing survey output indices with the comparable Fed's measure of factory production over the past ten years (using a three-month-on-three-month percent change), the IHS Markit data have exhibited an 89% correlation with the official data while the ISM's correlation is just 81%.

Turning points
Correlation is not just everything, however, as it's clearly important for surveys to accurately indicate turning points. With the exception of the period 2014-15, when the growth trend in the official data appears to have been distorted, the IHS Markit data have identified every major turning point in the US manufacturing cycle over the past ten years (based on using three-month moving averages of the survey and official data to identify turning points). In contrast, the ISM survey data have missed recent turning points.
Signals and noise
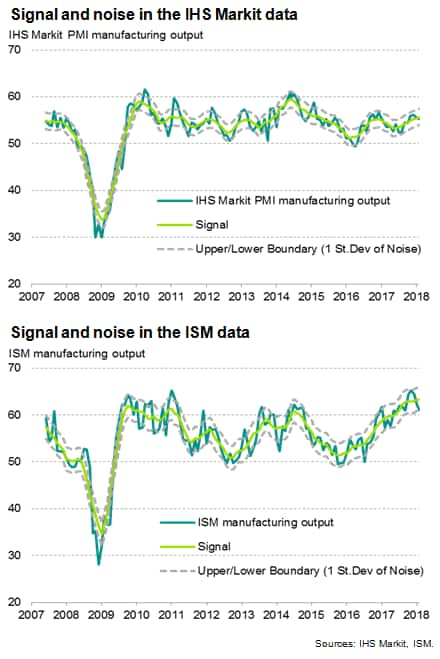
Comparisons of the manufacturing output indices from the IHS Markit and ISM surveys over the past 10 years also highlight the extent to which IHS Markit data exhibit a far better signal to noise ratio than the ISM, showing far lower volatility than the ISM output series and consequently making turning points easier to identify, growth rates easier to estimate and sending fewer false signals.
In this example we measure 'noise' in the survey data as the extent to which each month's value varies against a seven-month centred moving average. Over the past decade, IHS Markit data have exhibited an average 'noise' (or standard deviation) of just 1.8 index points compared to 2.5 for the ISM. The resulting 'bands of confidence' in which the two surveys' data can be interpreted are therefore very different, with a considerably greater degree of confidence being seen for the signal of the IHS Markit PMI compared to the ISM data.

{"items" : [
{"name":"share","enabled":true,"desc":"<strong>Share</strong>","mobdesc":"Share","options":[ {"name":"facebook","url":"https://www.facebook.com/sharer.php?u=http%3a%2f%2fwww.spglobal.com%2fmarketintelligence%2fen%2fmi%2fresearch-analysis%2fcomparisons-of-us-manufacturing-output-soft-data-accuracy.html","enabled":true},{"name":"twitter","url":"https://twitter.com/intent/tweet?url=http%3a%2f%2fwww.spglobal.com%2fmarketintelligence%2fen%2fmi%2fresearch-analysis%2fcomparisons-of-us-manufacturing-output-soft-data-accuracy.html&text=Comparisons+of+US+manufacturing+output+%e2%80%98soft+data%e2%80%99+accuracy+%7c+S%26P+Global+","enabled":true},{"name":"linkedin","url":"https://www.linkedin.com/sharing/share-offsite/?url=http%3a%2f%2fwww.spglobal.com%2fmarketintelligence%2fen%2fmi%2fresearch-analysis%2fcomparisons-of-us-manufacturing-output-soft-data-accuracy.html","enabled":true},{"name":"email","url":"?subject=Comparisons of US manufacturing output ‘soft data’ accuracy | S&P Global &body=http%3a%2f%2fwww.spglobal.com%2fmarketintelligence%2fen%2fmi%2fresearch-analysis%2fcomparisons-of-us-manufacturing-output-soft-data-accuracy.html","enabled":true},{"name":"whatsapp","url":"https://api.whatsapp.com/send?text=Comparisons+of+US+manufacturing+output+%e2%80%98soft+data%e2%80%99+accuracy+%7c+S%26P+Global+ http%3a%2f%2fwww.spglobal.com%2fmarketintelligence%2fen%2fmi%2fresearch-analysis%2fcomparisons-of-us-manufacturing-output-soft-data-accuracy.html","enabled":true}]}, {"name":"rtt","enabled":true,"mobdesc":"Top"}
]}


