Customer Logins
Obtain the data you need to make the most informed decisions by accessing our extensive portfolio of information, analytics, and expertise. Sign in to the product or service center of your choice.
Customer Logins
BLOG
Jul 26, 2018
Best post-crisis H1 Securities Lending revenue
- Equity revenues continue to rebound after challenging 2017
- Corporate bonds see demand and revenue growth
- HQLA demand pushes government bond revenues to best H1 on record
- EM equities poised to reap over $1bn in 2018 revenue
Global securities lending revenue had the best Q2 since 2015, delivering a total of $3.1bn, besting Q2 2017 by 16%. Adding that to the $2.6bn in Q1 revenues reveals that the first half of 2018 had the highest H1 post-crisis securities lending revenue. For some context, that is still 30% lower than the first half of 2008. The internals of that return have changed significantly however, with government bonds moving from 8% to 18% of lending revenues between Q2 2015 and 2018. Corporate bonds have also taken on an increased significance, moving from 4% to 6% of revenues, and the $184m in Q2 revenue was their best post-crisis quarterly revenue.
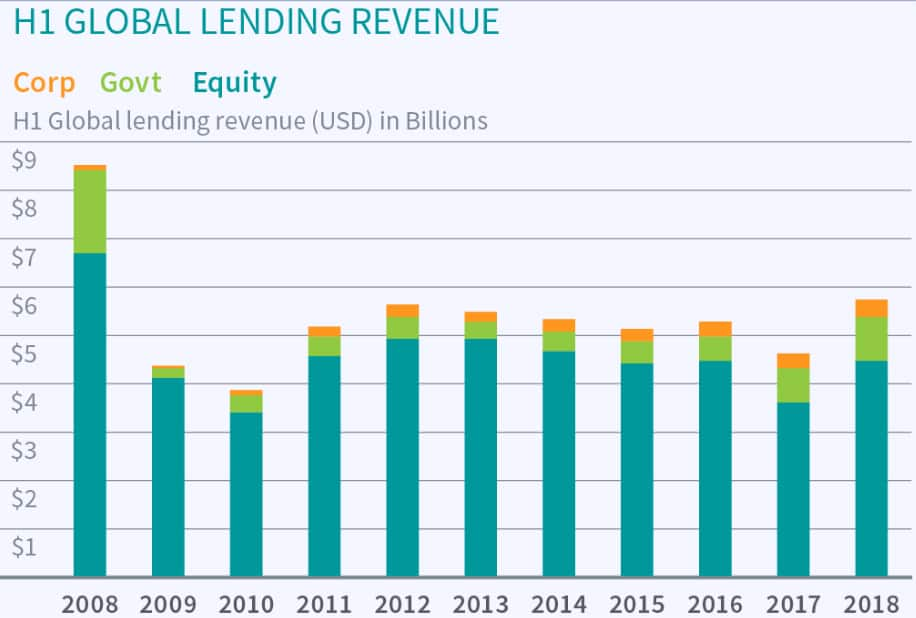
Demand for government bonds has remained near an all-time high, just above $1t. Commensurate with that, revenues have also increased − with the just over $900m earned in the first half of 2018 being the highest on record and 28% above the first half of 2017.
For equities, the 2nd quarter represented the first YOY increase in Q2 revenues since 2011. As we noted in the last issue, the first quarter set the tone in 2016/17 and that appears to be the case again in 2018, with a strong Q1 leading to an even stronger Q2. Despite the rise of fixed income lending, equities still account for more than 75% of global lending revenue.
The growth in equity lending revenue has been driven by Asia in recent years, with owners of Japanese equities enjoying Q2 revenue growth over 32% as compared with Q2 2017. The total Asia lending revenue of $546m was the highest level for a single quarter recorded; Combined with Q1 the $1bn in revenues is the highest revenue recorded in the first half of year (going back to 2006). No surprise then that matching the latter half of 2017 would result in 2018 being the best year on record for Asian equities lending revenue.
North American equities also showed solid growth, with the $831m in Q2 revenue being an improvement of 6% as compared with Q2 2017, though it is a small decline as compared with the first quarter of this year. For the first half of the year NA equities delivered $1.6bn, an encouraging result, but still 10% below the first half of 2016. While the first quarter saw a surge in Canadian equity revenues, on the back of Cannabis related borrows, declining fees in the 2nd quarter depressed revenues, despite balances remaining elevated.
It was a similar story for European equities, which delivered $929m in Q2, a 21% improvement over Q2 2017, though this is still well below the greater than $1bn in Q2 revenues for 2016.With that said it's encouraging to see the H1 European equity revenue best the prior year comparison for the first time since 2013.
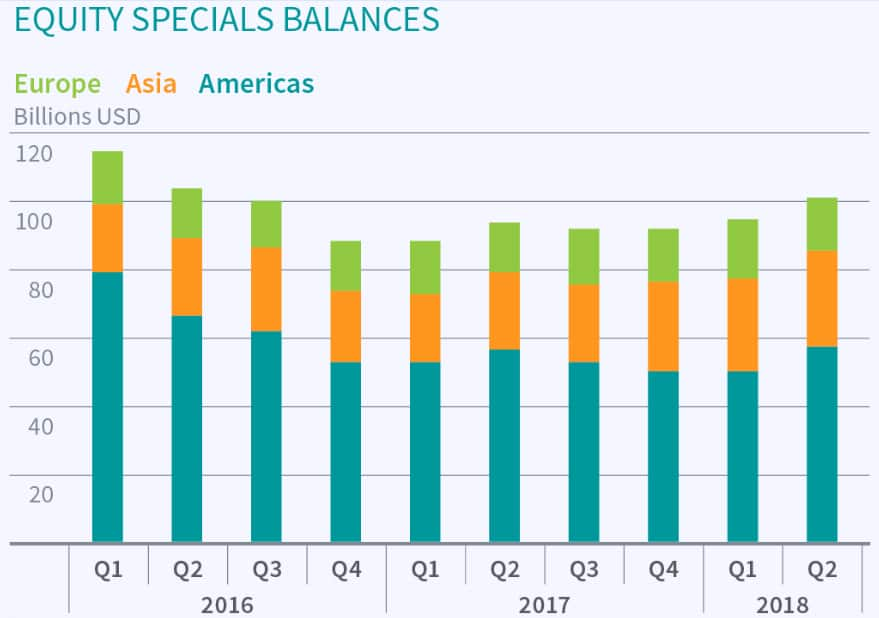
Part of the story has been the demand for specials, which has been trending back up since Q1 of 2017. US special balances have bounced back in part the result of the Tesla borrow balance reaching an all-time high in Q2, just over $12bn. The percentage of global equity loan balances with a fee above 100bps averaged 6.8% in Q2, down from 7.2% in Q1, though that is more the result of GC balances growing faster than specials. With equity revenues trending back toward the level seen in in the first half of 2016, while special balances are still below where they were at the time, there could be further upside ahead for equity lending revenue in the 2nd half of the year.
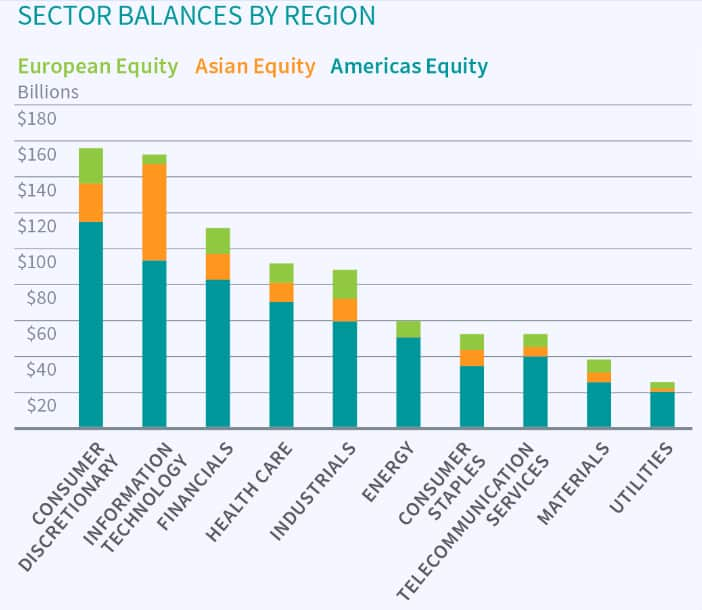
Consumer Discretionary is the most borrowed sector globally, bolstered by $12bn in TSLA balance, however it would be the most borrowed sector even excluding that. Similarly, the outsized Asia balances in Information Technology are largely the result of Alibaba, however even after excluding the just over $30bn in BABA balances IT remains the 2nd most borrowed sector.
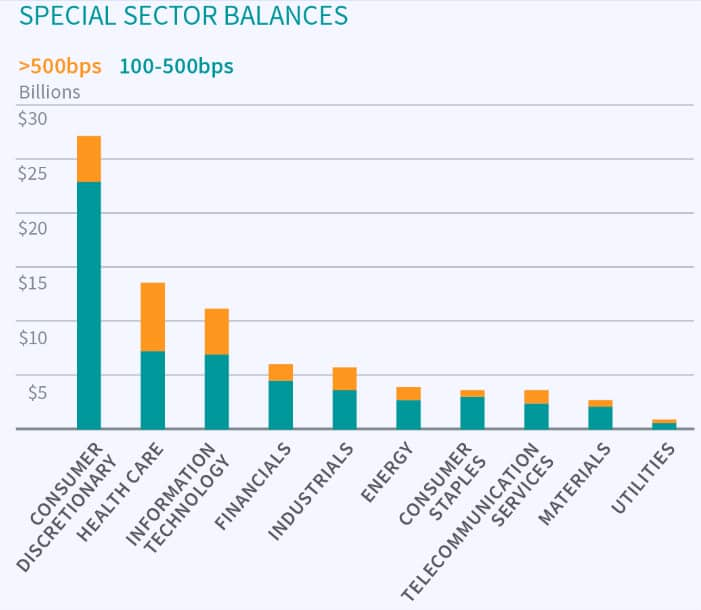
Zooming in sector specials, the Healthcare sector is revealed to have the largest percentage of special balances, with 7% of all balances on loan for greater than 500bps fee. Following that is Information Technology, where 2.7% of balances are against loans with fees greater than 500bps, though Consumer Discretionary is a very close 2nd. IT does not include the BABA balances, which remain easy to borrow despite being the most borrowed equity globally.
Borrow demand for corporate bonds has increased 32% since the start of 2017 and has bumped up against the $200bn peak in demand at the outset of Q2 and again in early June. Notably, the balances and revenues associated with specials, defined as fees above 75bps, have also been trending up. The elevated borrow demand comes from a number of sources, however rising interest rates and related re-financing needs have created trading opportunities which have contributed revenue to beneficial owners amidst the volatility in the first half of the year.
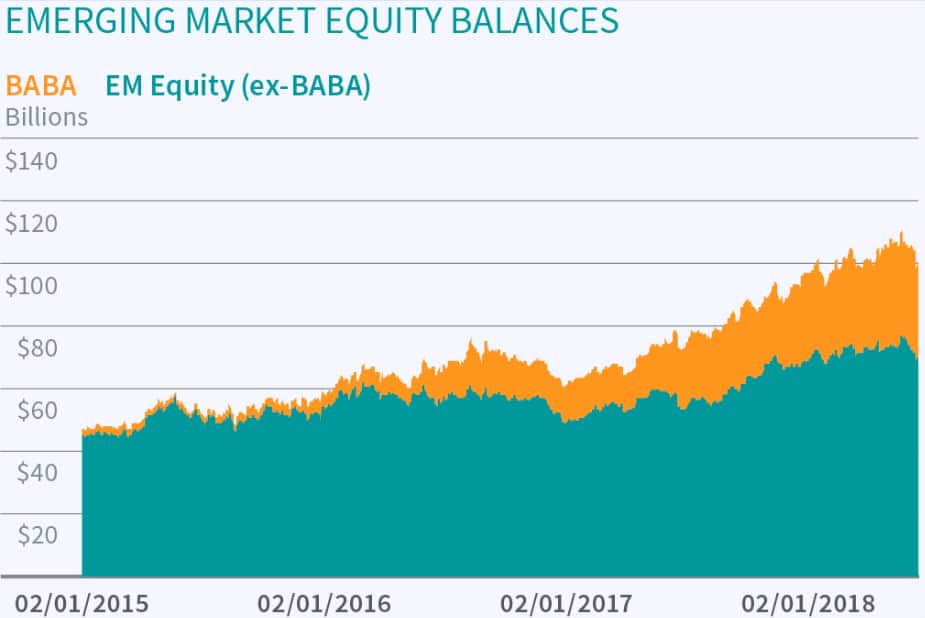
As noted above Alibaba is the most borrowed equity globally, however that's only part of the story in emerging market equity demand, which reached a post-crisis peak in June. Including BABA, EM balances are now over 11% of global equity balances, up from 8.8% at the start of 2017. Loan balances in Hong Kong, South Korea and Taiwan also peaked in early June, adding to the upswing in revenues in the region. While Asia EM rightly attracts most of the attention, it's worth noting that South Africa and LatAm are also seeing increasing demand and revenues. If the current trends persist EM equities will generate over $1bn in 2018 revenue.
As we noted in the previous edition of this review, there are strong tailwinds at the back of the industry, with equity GC and specials demand robust, corporate bond borrow demand spiking toward post-crisis highs and demand for HQLA continuing its rapacious increase. The market volatility in first half of the year has only enhanced these trends and borrow demand for Emerging Market equities and government bonds is poised to drive further revenue increases in the 2nd half of 2018. With trade wars dominating the news cycle, and inflation concerns being expressed on earnings calls, increasing lending revenue has helped offset the market volatility in the first half of the year.
S&P Global provides industry-leading data, software and technology platforms and managed services to tackle some of the most difficult challenges in financial markets. We help our customers better understand complicated markets, reduce risk, operate more efficiently and comply with financial regulation.
This article was published by S&P Global Market Intelligence and not by S&P Global Ratings, which is a separately managed division of S&P Global.
{"items" : [
{"name":"share","enabled":true,"desc":"<strong>Share</strong>","mobdesc":"Share","options":[ {"name":"facebook","url":"https://www.facebook.com/sharer.php?u=http%3a%2f%2fwww.spglobal.com%2fmarketintelligence%2fen%2fmi%2fresearch-analysis%2fbest-postcrisis-h1-securities-lending-revenue.html","enabled":true},{"name":"twitter","url":"https://twitter.com/intent/tweet?url=http%3a%2f%2fwww.spglobal.com%2fmarketintelligence%2fen%2fmi%2fresearch-analysis%2fbest-postcrisis-h1-securities-lending-revenue.html&text=Best+post-crisis+H1+Securities+Lending+revenue+%7c+S%26P+Global+","enabled":true},{"name":"linkedin","url":"https://www.linkedin.com/sharing/share-offsite/?url=http%3a%2f%2fwww.spglobal.com%2fmarketintelligence%2fen%2fmi%2fresearch-analysis%2fbest-postcrisis-h1-securities-lending-revenue.html","enabled":true},{"name":"email","url":"?subject=Best post-crisis H1 Securities Lending revenue | S&P Global &body=http%3a%2f%2fwww.spglobal.com%2fmarketintelligence%2fen%2fmi%2fresearch-analysis%2fbest-postcrisis-h1-securities-lending-revenue.html","enabled":true},{"name":"whatsapp","url":"https://api.whatsapp.com/send?text=Best+post-crisis+H1+Securities+Lending+revenue+%7c+S%26P+Global+ http%3a%2f%2fwww.spglobal.com%2fmarketintelligence%2fen%2fmi%2fresearch-analysis%2fbest-postcrisis-h1-securities-lending-revenue.html","enabled":true}]}, {"name":"rtt","enabled":true,"mobdesc":"Top"}
]}


