Using PMI survey data to predict official Hong Kong GDP growth rates
The Nikkei Hong Kong PMI" has been compiled by Markit's economics team since 1998 and has built a track record of accurately anticipating official data relating to economic growth, employment and inflation. The survey-based data, derived from Markit's carefully-structured panel of over 300 companies, offers investors, policymakers, business planners and other economy watchers with the most up to date guide to economic trends available.
One of the most commonly asked questions we receive is how to use the PMI to predict economic growth, to which we provide users with a simple but effective tool. More complex 'nowcasting' models can of course be developed using the PMI as one of many principal components, but few offer significantly greater accuracy than this straightforward and basic model.
In summary, a PMI of 46.8 indicates no change in GDP on a year ago, and each index point above or below 46.8 adds or subtracts 0.9% from the annual growth rate. Those wanting more background and detail can read on".
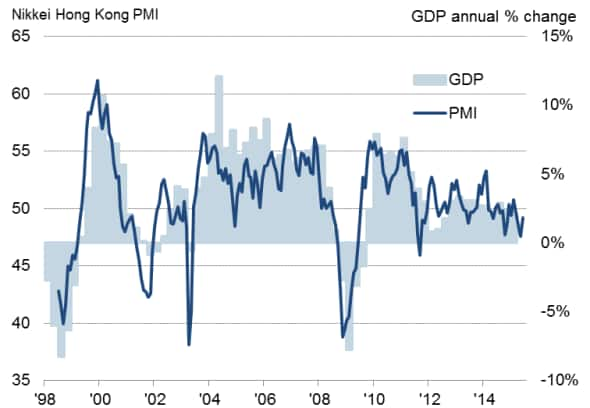
Monthly PMI data and GDP

Source: Markit, Nikkei, Ecowin.
Data differences fall in PMI's favour
In the first instance, it should be noted that the Nikkei Hong Kong PMI differs from many other PMI surveys conducted by Markit in that it covers the whole economy. This broad coverage makes the Hong Kong PMI especially well-suited to tracking gross domestic product (GDP).
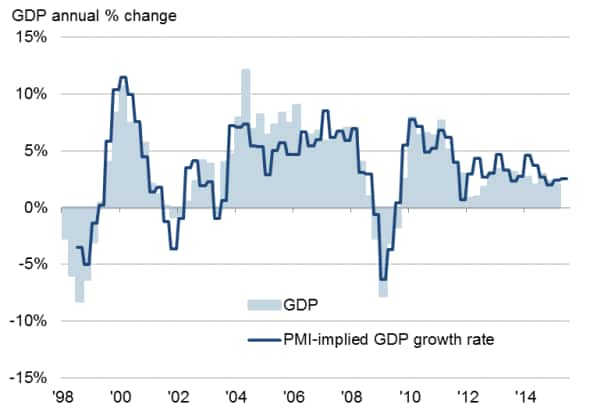
Complications come in the form of GDP data being published quarterly whereas PMI data are updated on a monthly basis. However, quarterly averages of the PMI can be used to facilitate comparisons, and clearly the higher frequency of publication is an added advantage of the PMI.
An additional issue is that, in Hong Kong, GDP growth is expressed as an annual percent change whereas the PMI measures monthly changes. However, in practice we can see that this merely means the PMI acts with an even longer lead than would otherwise be the case. Comparisons of historical data over the 16 years between 1998-2014 show the PMI exhibits the highest correlation - some 88% - when it acts with a two-month lead over GDP.
PMI-implied growth rates
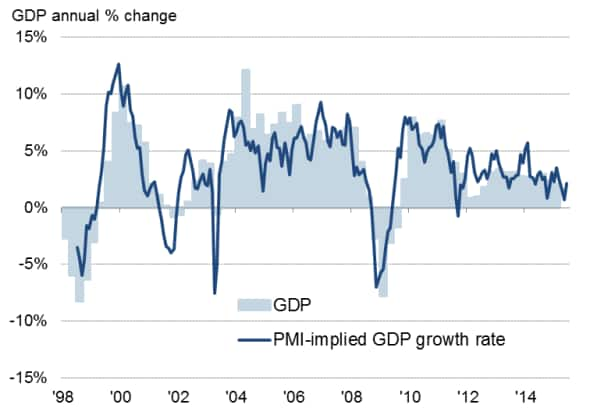
Having established the optimal timing advantage of the PMI, an important next step is to derive implied GDP growth rates from the PMI, which is expressed as an index which varies around the neutral level of 50 (50 being the level at which the number of positive survey respondents equals the number of negative responses).
Simple OLS regression analysis is used whereby the annual rate of change of GDP is explained by the sole variable of the PMI, which is in turn calculated as a quarterly average lagged by two months.
This regression yields a robust adjusted r-square of 0.774, and allows us to estimate GDP using the following formula:
GDP annual % change = (PMI x 0.00876) -0.40963
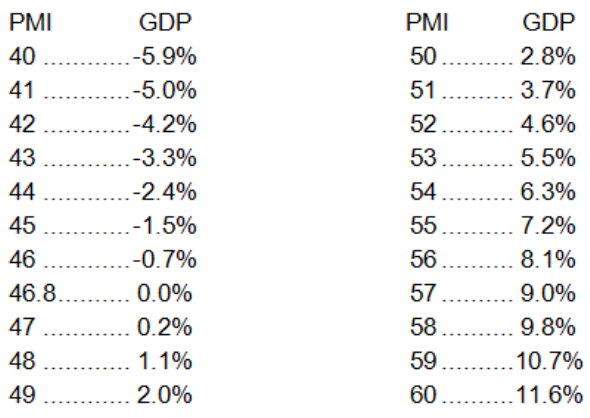
A PMI of 46.8 is therefore indicative of GDP being unchanged on a year earlier. Each index point adds or subtracts 0.9% from the annual growth rate.
As a 'ready reckoner', the following guidance can be used:
PMI and implied GDP annual % change

Monthly PMI implied GDP growth rates

Source: Markit, Nikkei, Ecowin.
GDP growth rates derived from quarterly PMI averages with lead applied

Source: Markit, Nikkei, Ecowin.
Other countries
Please visit the research section of www.markit.com/commentary/economics for PMI-based GDP nowcasts for other countries.