Customer Logins
Obtain the data you need to make the most informed decisions by accessing our extensive portfolio of information, analytics, and expertise. Sign in to the product or service center of your choice.
Customer Logins
EQUITIES COMMENTARY
May 28, 2015
Brics' investor sentiment diverges
Investor appetite for exposure to the Brics' component nations has increasingly diverged, with large outflows from Chinese ETFs ahead of cooling in the stock market and India seeing steady inflows.
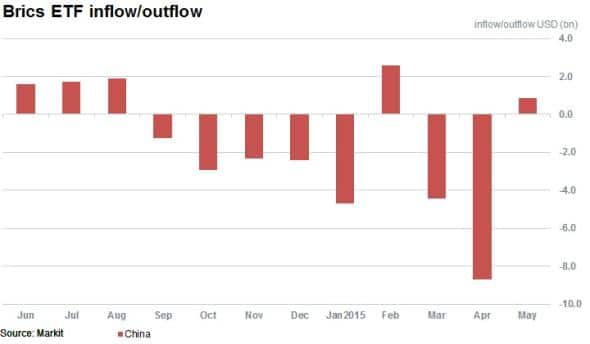
- Record $24bn of outflows seen from Chinese ETFs finally looks set to die down
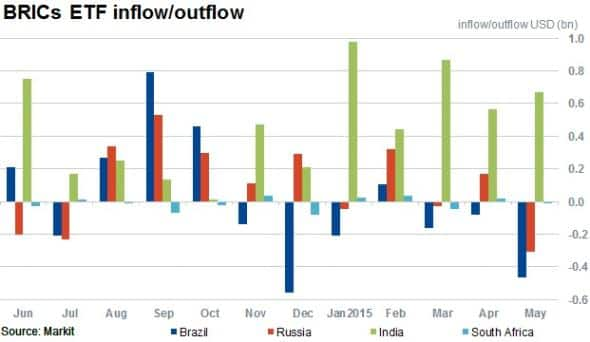
- Indian ETFs have attracted 12 months of consecutive inflows, totalling $5.5bn
- Brazilian and Russian ETFs have both seen large outflows occur in May 2015
Bric-a-brac
Since the coining of the "Brics" acronym, the trajectories of its constituents appear to be increasingly diverging. To measure subsequent investor sentiment towards the nations, ETF flows are a useful tool to highlight changing appetites.
Most recently India has been the stand out winner in terms of ETF inflows totalling $5.5bn. In Russia ETF investors have tried to time the bottom of the market as inflows continued despite sanctions and the roubles' fall. Russia, like the Brazilian economy, is heavily exposed to oil prices, which have recovered in recent months. But despite the recent upturn in prices, Brazil has seen strong ETF outflows since last November.

The other three constituent nations; China, India and South Africa (added in 2010) have generally benefited from lower oil prices as net importers.
India's benchmark index, the Sensex, rose by a robust 30% in 2014 as a new prime minister buoyed markets and lower oil prices curbed inflation. 2015 however has so far been less impressive, with the Indian benchmark relatively flat year to date. New controversial taxes and a weaker rupee may explain the lack of movement in the market, but ETF flows indicate bullish investor appetite for the market.
Geographic rotation
The largest two ETFs tracking the Indian market are the iShares India MSCI ETF (INDA) and the Wisdom Tree India Earnings Fund ETF (EPI). These two funds represent ~50% of total India exposed AUM, with $3.8bn and $2.5bn in AUM respectively.
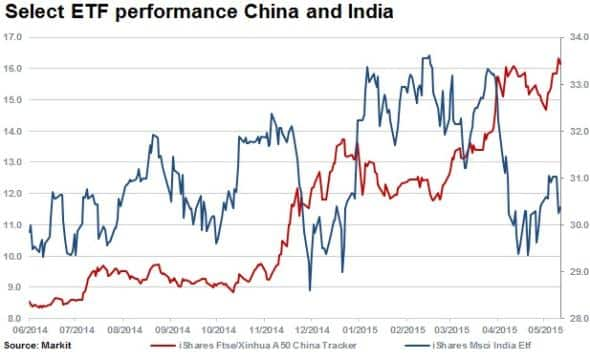
The iShares FTSE/Xinhua A50 China Tracker is the largest ETF tracking Chinese equities with $8.1bn in AUM. The fund's NAV is up by an impressive 89% over the last 12 months. This compared to the INDA ETF which is up by only 2.6% over the last 12 months.

While investors have channelled funds into Indian ETFs despite lacklustre performance, funds have been pulled out of Chinese focused ETFs which dwarf other Brics nations ETFs in magnitude. $24.2bn flowed out of Chinese funds from September 2014 through to April 2015. The direction of flow has changed in May 2015 however, with $855m of inflows recorded.

The large cumulative outflows from Chinese ETFs has effectively been the actions of ETF investors taking half of the stock returns generated in the past 12 months off the table.
Chinese equity ETFs' AUM at the end of June 2014 totalled $55bn. An almost 90% rally in markets and subsequent increase in estimated ETF NAV would have had ending AUM in the region break through $100bn in 2015, but with equity outflows of $28bn, ending equity AUM as of May 2015 stood at $83.5bn.
Relte Stephen Schutte | Analyst, Markit
Tel: +44 207 064 6447
relte.schutte@markit.com
S&P Global provides industry-leading data, software and technology platforms and managed services to tackle some of the most difficult challenges in financial markets. We help our customers better understand complicated markets, reduce risk, operate more efficiently and comply with financial regulation.
This article was published by S&P Global Market Intelligence and not by S&P Global Ratings, which is a separately managed division of S&P Global.
{"items" : [
{"name":"share","enabled":true,"desc":"<strong>Share</strong>","mobdesc":"Share","options":[ {"name":"facebook","url":"https://www.facebook.com/sharer.php?u=http%3a%2f%2fwww.spglobal.com%2fmarketintelligence%2fen%2fmi%2fresearch-analysis%2f28052015-Equities-Brics-investor-sentiment-diverges.html","enabled":true},{"name":"twitter","url":"https://twitter.com/intent/tweet?url=http%3a%2f%2fwww.spglobal.com%2fmarketintelligence%2fen%2fmi%2fresearch-analysis%2f28052015-Equities-Brics-investor-sentiment-diverges.html&text=Brics%27+investor+sentiment+diverges","enabled":true},{"name":"linkedin","url":"https://www.linkedin.com/sharing/share-offsite/?url=http%3a%2f%2fwww.spglobal.com%2fmarketintelligence%2fen%2fmi%2fresearch-analysis%2f28052015-Equities-Brics-investor-sentiment-diverges.html","enabled":true},{"name":"email","url":"?subject=Brics' investor sentiment diverges&body=http%3a%2f%2fwww.spglobal.com%2fmarketintelligence%2fen%2fmi%2fresearch-analysis%2f28052015-Equities-Brics-investor-sentiment-diverges.html","enabled":true},{"name":"whatsapp","url":"https://api.whatsapp.com/send?text=Brics%27+investor+sentiment+diverges http%3a%2f%2fwww.spglobal.com%2fmarketintelligence%2fen%2fmi%2fresearch-analysis%2f28052015-Equities-Brics-investor-sentiment-diverges.html","enabled":true}]}, {"name":"rtt","enabled":true,"mobdesc":"Top"}
]}


