European equity trading regains its swagger
After a great start to the year, European cash equities trading volumes held onto their momentum in a volatile second half, which saw the value of trades reported by contributing brokers to Markit MSA in 2015 jump significantly from 2014's total.
- Aggregate European equities volumes in 2015 jumped by a quarter to "12.3trn
- Morgan Stanley topped the league table, but the gap to second ranked BAML is narrowing
- Volumes have held up in the volatile first three weeks of 2016
Read the full report with broker rankings.
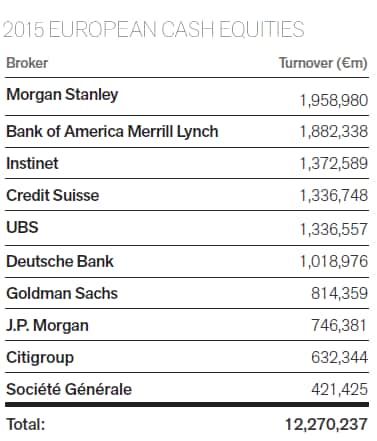
Last year was a banner year for European equity trading as the market snapped back to life after several years in the doldrums. The first half was mainly fuelled by investor desire to gain a piece of the ECB driven rally which saw equity indices surge in the first weeks of the year. The second half of 2015 was more volatile for equities across the region, but cash equity trading volumes managed to hang onto the strong volume gains seen in the opening half of the year. Overall, the aggregate cash equity trading volume reported by contributors to the Markit MSA dataset was "12.3trn, a quarter more than the previous year's total.
The volatility seen in the opening weeks of 2016 also looks set to make the year an interesting one for equity trading volumes as aggregate volume across the region is up by 1% from the same period a year ago.
Morgan Stanley top in tight race
The rankings of the top ten largest contributing brokers, from a universe of 26 contributing clients, were little changed over the year. These ten were unchanged in their composition although several firms saw their positions change.

Morgan Stanley managed to come out on top of the broker rankings as the bank reported "1.96trn of executed client business over the year. While the bank has regularly featured at the top of the MSA broker rankings for the last four years, its lead over second ranked broker Bank of America Merrill Lynch, "77bn, was down by over three quarters from 2014. This tight race was helped by Bank of America's strong showing in UK shares as the bank took top spot on the FTSE 100 league table with "631bn of executed business.
The race for third place was equally tight with Instinet eventually prevailing over Credit Suisse and UBS. Further down the table, JP Morgan switched places with Citigroup in eight place.
Jump in trading evenly spaced
No one sector or country was responsible for the surge in trading volume, although the large cap FTSE 100, CAC 40 and DAX 30 indices provided over half of the "2.5trn increase in trading activity. Midcap shares as tracked by the Stoxx 600 Mid index also registered a strong year as its constituents saw a "525bn increase in volume traded over the year.
Interestingly, small cap shares did not see as strong a jump in trading volume as their larger peers with the Stoxx 600 Small cap index only seeing a 23% rise in volume traded. UK shares which make up the FTSE AIM All Share index actually saw a fall in volume traded with the index seeing "39bn in volume traded, "16bn less than the previous year's total.
ETFs continue to see trading rise
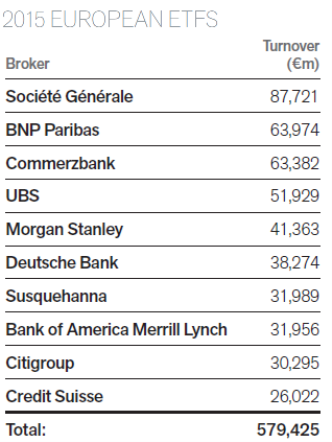
The year also proved to be record breaking for ETFs as the asset class registered record inflows in Europe. These record inflows translated into the secondary market with contributing brokers reporting a record "579bn of executed business, 32% more than the previous year's tally. This was helped by bond products whose volumes jumped by a better than average 43%.
Societe Generale continues to hang on to the top spot of the broker rankings, helped by trading in its Lyxor products. Fellow French bank BNP overtook Commerzbank to take second place in the league table.

This analysis accompanies a summary of European cash equity and ETF trading for H1 2015 using Markit's suite of equity products. Markit MSA covers an estimated 80% of all cash equity trading in Europe across traditional exchanges, multi-lateral trading facilities and over-the-counter markets. Trade data is sourced directly fromcontributing brokersand represents what was actually traded, differentiating it from other surveys that rely on indications of interest or trade adverts.
Simon Colvin, Research Analyst at IHS Markit
Posted 28 January 2016
S&P Global provides industry-leading data, software and technology platforms and managed services to tackle some of the most difficult challenges in financial markets. We help our customers better understand complicated markets, reduce risk, operate more efficiently and comply with financial regulation.
This article was published by S&P Global Market Intelligence and not by S&P Global Ratings, which is a separately managed division of S&P Global.