Customer Logins
Obtain the data you need to make the most informed decisions by accessing our extensive portfolio of information, analytics, and expertise. Sign in to the product or service center of your choice.
Customer Logins
EQUITIES COMMENTARY
Oct 19, 2015
Short conviction drives fee spikes in US
A record number of expensive to short stocks, or "specials", are currently present in US equity markets, with short sellers' convictions seeing them increasingly prepared to pay up for expected price declines.
- High marginal fees to borrow seen to generally revert to all day averages relatively quickly
- A historically high proportion of US stocks currently seeing high demand and fees
- Fee spikes on average preceded by a decline in price, followed by a rally into the peak fee
Hot shorts
Spikes in fees charged to short sellers to borrow stock are often driven by relatively short term imbalances of supply and demand. For this note average fees*, utilisation, loan value and cumulative price changes are analysed leading up to and following a dramatic increase in fees. This is reviewed across 80 US securities where fees spiked to levels above 35% over the past three years. The charts below show the 30 days preceding and following fee spike events.
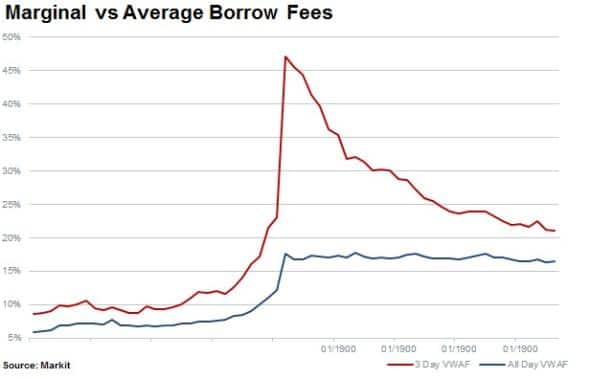
The increased rush in short term demand to borrow individual names elevates marginal rates, lifting the average fee for all transactions higher. However, the percentage of loans priced at those levels is low.
Average utilisation shows the increasing imbalance in supply and demand, which results in the fee spike. Increases in utilisation often represent both an increase in short demand and a reduction in lendable inventory as short sellers and long holders sell shares.
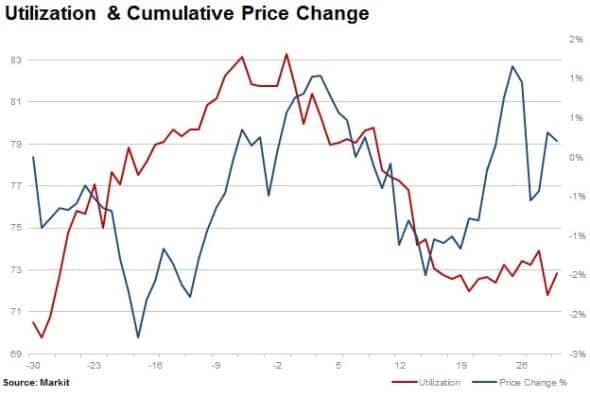
The above indicates that there may be room for short sellers (and stock lenders alike) to optimise on fees paid and charged. As supply makes its way to the market, lenders will undoubtedly charge discriminate rates based on individual supply constraints and access to pricing information.
Worth the price paid
The average cumulative price change (above) shows a decline followed by a rally into the fee spike, which suggests that shorts may see the rally as a quality entry point in potentially vulnerable stocks. Looking at the 30 days preceding and following a fee spike, share prices on average witness a small gain. However, shorting at peak fee would be profitable before borrow costs.
A recent example of a security experiencing a rapid spike in borrow costs is Laredo Petroleum (LPI). Following a price decline which saw shares trade down 30% from July 10th to August 5th, the borrow costs increased rapidly into September. More recently the borrow costs have come down as shorts covered, in part fuelling the rally which has seen the share price rise back above the levels seen in early July.
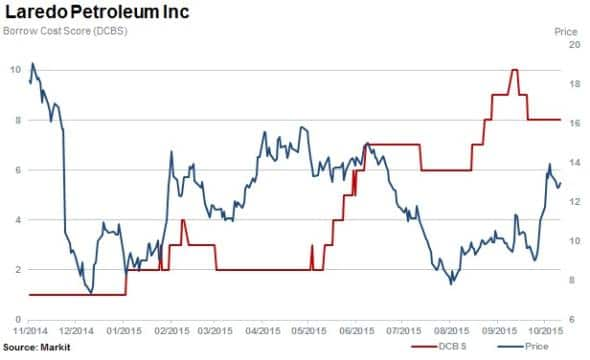
There was a reduction in borrow demand as the price declined in late July/early August, followed by an increase in demand as the shares rallied, suggesting some shorts may have profited initially. Using the rally as an entry point has not paid off thus far.
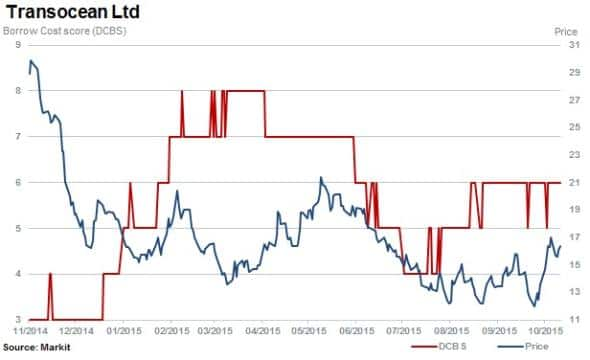
Another energy related firm which saw a fee spike in 2015 was Transocean (RIG). This trade is the model short sellers were hoping to follow with LPI. A price decline preceded a rally, which short sellers used as an entry point ahead of a more significant leg down in price. This dip in price followed by a larger leg down was subsequently repeated in the stock on a larger scale in later 2015. However, by that time the lendable inventory had increased and stabilised, which kept borrow rates in check.
Conviction of shorts at a multi-year high
The proportion of names where the cost to borrow ranks above 3 on a daily cost to borrow score (DCBS) basis (ratings of 1 to 10) has increased to the highest level seen since the financial crisis.
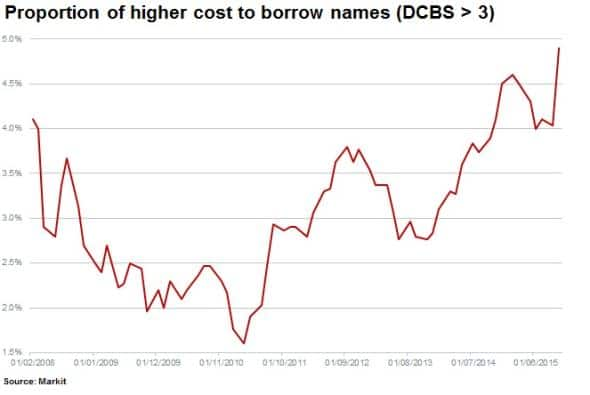
Stocks with a DCBS score of above 3 currently represent 4.9% of the Russell 3000 index, up over threefold since early 2011 (assuming a retrospective and static universe of stocks).
Across this same universe, there are also currently the highest number of expensive to borrow names or "specials", which have a DCBS score of 10.
*The marginal and average rates mentioned above are those paid by prime brokers to source borrows from either agent lenders or other brokers. The rates paid by hedge funds would be elevated above these levels. We used the cost scores in the security detail, but would be happy to provide more rate detail appropriate to your market segment on request.
S&P Global provides industry-leading data, software and technology platforms and managed services to tackle some of the most difficult challenges in financial markets. We help our customers better understand complicated markets, reduce risk, operate more efficiently and comply with financial regulation.
This article was published by S&P Global Market Intelligence and not by S&P Global Ratings, which is a separately managed division of S&P Global.
{"items" : [
{"name":"share","enabled":true,"desc":"<strong>Share</strong>","mobdesc":"Share","options":[ {"name":"facebook","url":"https://www.facebook.com/sharer.php?u=http%3a%2f%2fwww.spglobal.com%2fmarketintelligence%2fen%2fmi%2fresearch-analysis%2f19102015-Equities-Short-conviction-drives-fee-spikes-in-US.html","enabled":true},{"name":"twitter","url":"https://twitter.com/intent/tweet?url=http%3a%2f%2fwww.spglobal.com%2fmarketintelligence%2fen%2fmi%2fresearch-analysis%2f19102015-Equities-Short-conviction-drives-fee-spikes-in-US.html&text=Short+conviction+drives+fee+spikes+in+US","enabled":true},{"name":"linkedin","url":"https://www.linkedin.com/sharing/share-offsite/?url=http%3a%2f%2fwww.spglobal.com%2fmarketintelligence%2fen%2fmi%2fresearch-analysis%2f19102015-Equities-Short-conviction-drives-fee-spikes-in-US.html","enabled":true},{"name":"email","url":"?subject=Short conviction drives fee spikes in US&body=http%3a%2f%2fwww.spglobal.com%2fmarketintelligence%2fen%2fmi%2fresearch-analysis%2f19102015-Equities-Short-conviction-drives-fee-spikes-in-US.html","enabled":true},{"name":"whatsapp","url":"https://api.whatsapp.com/send?text=Short+conviction+drives+fee+spikes+in+US http%3a%2f%2fwww.spglobal.com%2fmarketintelligence%2fen%2fmi%2fresearch-analysis%2f19102015-Equities-Short-conviction-drives-fee-spikes-in-US.html","enabled":true}]}, {"name":"rtt","enabled":true,"mobdesc":"Top"}
]}


