Customer Logins
Obtain the data you need to make the most informed decisions by accessing our extensive portfolio of information, analytics, and expertise. Sign in to the product or service center of your choice.
Customer Logins
EQUITIES COMMENTARY
Feb 18, 2015
Smart beta: the flavour of the year
As ETFs become 'smarter' and differentiate further to offer different exposures, a comparison against passive funds reveals whether investors have indeed benefited over the last year in terms of returns.
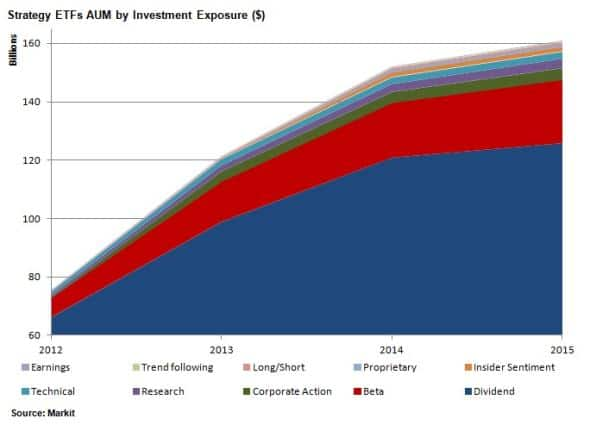
- Strategy ETFs have surpassed $160bn in AUM in 2015 so far
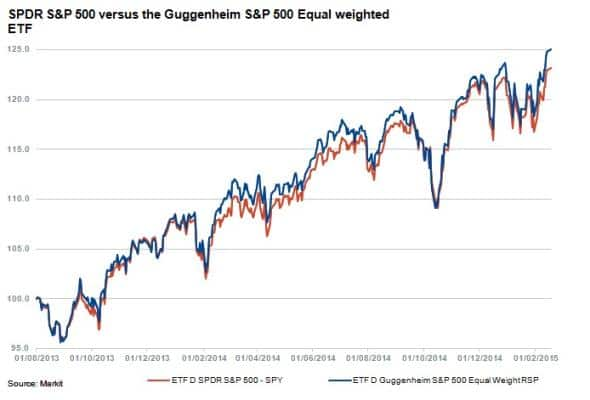
- Guggenheim S&P 500 Equal Weight ETF sees $3.2bn inflows and outperforms SPDR S&P 500
- Fundamental weighted MSCI USA ETFs performance beaten by market weighted counterpart
Smart beta
One of the biggest buzzwords in the ETF space right now is the term "smart beta". Smart beta is discussed in industry conferences, debated in trade publications, praised by asset managers and questioned by investors. While the terminology itself is a topic of much debate, the main question is how have smart beta ETFs been performing relative to their passive counterparts, and whether the end investors have benefitted from these emerging strategies.
To begin, this article will define smart beta ETFs as funds using alternative weightings that differ from the vanilla market cap weighting methodologies. These ETFs find themselves somewhere between passive and active funds. Smart beta looks to gain the edge of a systematic trading strategy to boost investors' returns and at the same time provide the safety of a passive index. While the science of an alternative weighting is applied, the index generally draws its selection of equities from a parent index that is market cap weighted. This gives investors the satisfaction of a limited universe from which the asset manager will be selecting from while also providing the opportunity to beat the index through a varying strategy.
The four main alternative weighting methodologies that have received the most attention are equally weighted indexes, fundamentally weighted indexes, factor-based indexes and low volatility indexes.

Equally weighted
Equally weighted indexes are as they sound. The components of the index are selected from an index such as the S&P 500 but are equally weighted so that that all components have identical weights when rebalanced.

The Guggenheim S&P 500 Equal Weight ETF is one of the leading ETFs in this group with close to $11bn in assets under management and has seen $3.23bn in inflows over the past year. The NAV Total Return for RSP over the last year was 17.03% while its market-cap weighted counterpart, the SPDR S&P 500 ETF, saw 16.81% over the same time period.
Fundamentally weighted
ETFs that use a fundamental weighting strategy provide broad exposure to an equity market based on market capitalisation, but use fundamental factors such as earnings or dividends to weigh the constituents.
Dividend focused ETFs are some of the more popular smart beta ETFs on the market. Companies that pay regular dividends tend to be in better financial health and produce sustained earnings. In addition to this, companies that consistently raise their dividend payouts also raise the bar on their own performance expectations.
One of the strongest performing smart beta ETFs to date has been the Vanguard Dividend Appreciation ETF. The fund looks to invest in stable, dividend paying companies with an emphasis on quality rather than yield. All of the securities that comprise the underlying index have at least ten consecutive years of increasing annual regular dividend payments. VIG has over $21bn in AUM and saw $584m in asset flows over the past year.
Factor based
Factor based weighting commonly combines several fundamental factors to determine the optimal weighting of the security. Factor-based indexes can also divide the parent index into tiers based on certain factors and then equally weight the securities within those tiers.

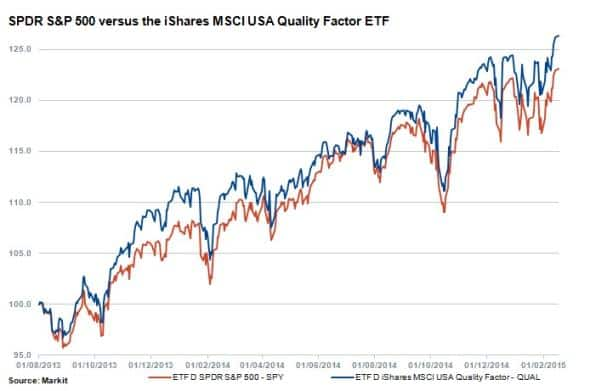
iShares MSCI USA Quality Factor ETF (QUAL) is the largest ETF within this classification of smart beta weighting methodologies. The underlying index creates a score based on three fundamental variables; return on equity, debt to equity and earnings variability. QUAL has $1.08bn in assets under management and has gained $672m in assets over the last year. The comparable market cap weighted ETF, iShares MSCI USA ETF, saw outflows of $96m over the same time period. While investors seemed to favour the alternatively weighted ETF, it is interesting to note that iShares MSCI USA ETF performed better than its quality focused counterpart, QUAL, over the past year when comparing NAV Total Return. EUSA is up 16.61%, just beating out the 16.16% return from QUAL.
Low volatility
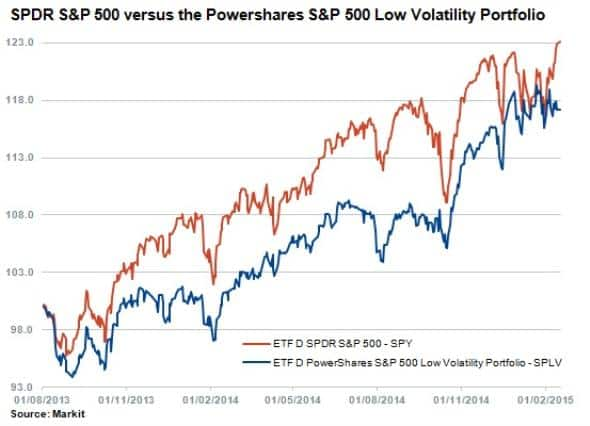
Low volatility weighting simply involves fund components that are weighted based on their historic volatility. With $5.71bn in assets under management, PowerShares S&P 500 Low Volatility Portfolio ETF is the largest of the funds that utilise a low volatility weighting methodology. SPLV has seen total returns of 19.34% over the past year, beating the S&P 500 which saw 16.81% in total returns over the same time. This difference is a direct example of the smart beta strategy benefiting the investor. By weighting the less volatile securities more heavily, investors were able to achieve additional returns.

Growth expected
There are a wide variety of smart beta strategies offered by ETF asset managers and it is a trend that is expected to grow. As asset managers fight for investor assets, the need for unique strategies that promise returns above the market is likely to spawn several strategies in order to differentiate against the competition. In many cases, the asset flows might only be indicative of the flavour of the month. Newly developed strategies may lead to further innovation in the rapidly growing and evolving ETF space.
James Hohorst | ETF Analyst, Markit
Tel: +1 646 679 3012
james.hohorst@markit.com
S&P Global provides industry-leading data, software and technology platforms and managed services to tackle some of the most difficult challenges in financial markets. We help our customers better understand complicated markets, reduce risk, operate more efficiently and comply with financial regulation.
This article was published by S&P Global Market Intelligence and not by S&P Global Ratings, which is a separately managed division of S&P Global.
{"items" : [
{"name":"share","enabled":true,"desc":"<strong>Share</strong>","mobdesc":"Share","options":[ {"name":"facebook","url":"https://www.facebook.com/sharer.php?u=http%3a%2f%2fwww.spglobal.com%2fmarketintelligence%2fen%2fmi%2fresearch-analysis%2f18022015-Equities-Smart-beta-the-flavour-of-the-year.html","enabled":true},{"name":"twitter","url":"https://twitter.com/intent/tweet?url=http%3a%2f%2fwww.spglobal.com%2fmarketintelligence%2fen%2fmi%2fresearch-analysis%2f18022015-Equities-Smart-beta-the-flavour-of-the-year.html&text=Smart+beta%3a+the+flavour+of+the+year","enabled":true},{"name":"linkedin","url":"https://www.linkedin.com/sharing/share-offsite/?url=http%3a%2f%2fwww.spglobal.com%2fmarketintelligence%2fen%2fmi%2fresearch-analysis%2f18022015-Equities-Smart-beta-the-flavour-of-the-year.html","enabled":true},{"name":"email","url":"?subject=Smart beta: the flavour of the year&body=http%3a%2f%2fwww.spglobal.com%2fmarketintelligence%2fen%2fmi%2fresearch-analysis%2f18022015-Equities-Smart-beta-the-flavour-of-the-year.html","enabled":true},{"name":"whatsapp","url":"https://api.whatsapp.com/send?text=Smart+beta%3a+the+flavour+of+the+year http%3a%2f%2fwww.spglobal.com%2fmarketintelligence%2fen%2fmi%2fresearch-analysis%2f18022015-Equities-Smart-beta-the-flavour-of-the-year.html","enabled":true}]}, {"name":"rtt","enabled":true,"mobdesc":"Top"}
]}


