Customer Logins
Obtain the data you need to make the most informed decisions by accessing our extensive portfolio of information, analytics, and expertise. Sign in to the product or service center of your choice.
Customer Logins
EQUITIES COMMENTARY
Dec 14, 2016
Corporate bond lending and liquidity risk
Bond lending has been one of the highlights of the securities lending market for 2016, but has this success been driven by a surge up the risk curve?
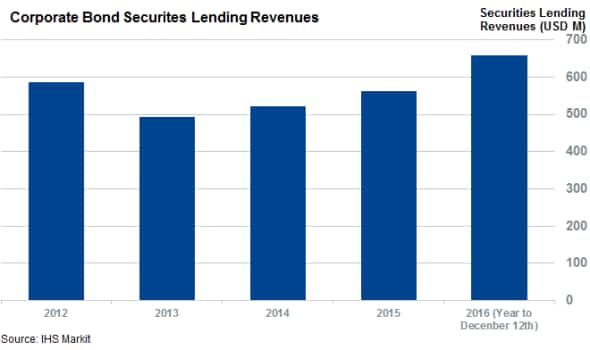
- Revenues generated by corporate bonds ytd already 16% ahead of the 2015 total
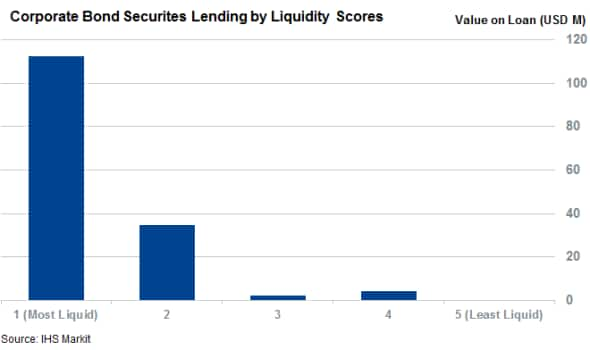
- Liquid bonds make up 95% of corporate bond loans according to Markit Pricing data's bond liquidity scores
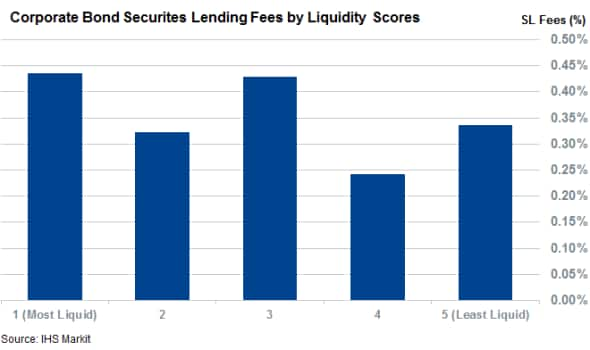
- Lenders are failing to charge a premium for the minority of loans made against illiquid bonds
Corporate bonds have been one of the success stories of the securities lending market in 2016. With just over two weeks left in the year, the aggregate revenues generated from lending out the asset class are already 16% ahead of last year's total. In fact, the $657m of revenues generated by the $2.8trillion of corporate bonds in the Markit Securities Finance database represents the most lucrative year for the asset class in over five years. Corporate bonds are now responsible for 8.3% of the total securities lending industry's revenues; a full percentage point more that last years' contribution.

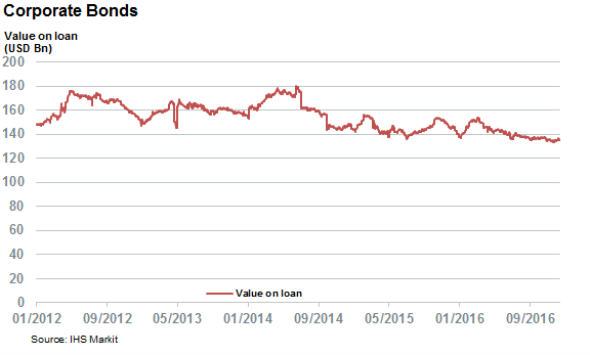
A further dive into the revenue drivers indicates that the extra revenue generated by corporate bond lending so far this year has been entirely driven by better pricing of outstanding loans as the average daily loans across the asset class has fallen by 3% this year to date (ytd) with $141bn of loans outstanding on loan on any given day, the smallest average in over five years.

Fees have more than compensated for this lackluster demand to borrow the asset class, as the weighted average fees commanded by corporate bonds in 2016 so far - 35bps - was 19.3% higher than 2015's weighted average fee.
Liquid bonds see most activity
As ever in financial markets, one has to wonder whether this revenue bonanza has been driven by the industry taking on additional risk, especially liquidity risk, which looms over OTC traded corporate bonds. However, indicators from the Markit Pricing Data's bond liquidity scores, which were recently made available through the Markit Securities Finance Portal, do not seem to indicate that the industry is taking on any material liquidity risk by lending corporate bonds as 95% of the current outstanding corporate bond loans are made out against bonds which score in the top two liquidity buckets.
These liquidity scores calculated using metrics such as bid-ask spread calculated from Markit EVB, reported cash market liquidity, and the depths of dealer quotes on both on the individual bond and parent entity. The most liquid bonds earn a score of 1, on a scale of 1-5.

The market also appears to be actively steering clear of bonds which all in the two least liquid buckets have a utilisation rate of 0.8% against 5.7% for their peers in the two most liquid buckets.
Liquid bonds, which earn either of the two highest liquidity scores, are also much more likely to see borrowing activity as 44% of these bonds which sit in lending programs have some outstanding loans. The chance that an illiquid (defined by a liquidity score of between 3-5) sees any demand borrow is half that as 22% of these bond now have loans against them.
Market not pricing in liquidity risk
While the corporate bond securities lending market is overwhelmingly made up of loans made against liquid bonds, we do see evidence that loans made against the less liquid end of the corporate bond market are failing to account for the extra liquidity risk being taken on. This trend is evidenced by the fact that the weighted average fees across the $4.8bn of loans made against bonds which score in the two least liquid buckets stands at 25bps. This puts the average fee across these illiquid bonds materially lower than the 44bps earned by the loans made out to the most liquid bonds and 32bps for those in second most liquid bucket.

One such instrument is Verizon Pennsylvania's 8.75% note due August 2031 which has $15.3M of outstanding loans at fee of 7bps despite earning the lowest possible liquidity score of 5.

This relative underpricing of liquidity risk is the reason why we have made our unparalleled bond liquidity metrics available both in our front end as well as through the Markit Securities Finance Toolkit for Excel. We hope that such underpricing, though relatively rare in the grand scheme of things, become less common in the future as we empower the industry to properly gauge and in turn price liquidity risk taken on by bond lending.
Simon Colvin | Research Analyst, Markit
Tel: +44 207 264 7614
simon.colvin@markit.com
S&P Global provides industry-leading data, software and technology platforms and managed services to tackle some of the most difficult challenges in financial markets. We help our customers better understand complicated markets, reduce risk, operate more efficiently and comply with financial regulation.
This article was published by S&P Global Market Intelligence and not by S&P Global Ratings, which is a separately managed division of S&P Global.
{"items" : [
{"name":"share","enabled":true,"desc":"<strong>Share</strong>","mobdesc":"Share","options":[ {"name":"facebook","url":"https://www.facebook.com/sharer.php?u=http%3a%2f%2fwww.spglobal.com%2fmarketintelligence%2fen%2fmi%2fresearch-analysis%2f14122016-Equities-Corporate-bond-lending-and-liquidity-risk.html","enabled":true},{"name":"twitter","url":"https://twitter.com/intent/tweet?url=http%3a%2f%2fwww.spglobal.com%2fmarketintelligence%2fen%2fmi%2fresearch-analysis%2f14122016-Equities-Corporate-bond-lending-and-liquidity-risk.html&text=Corporate+bond+lending+and+liquidity+risk","enabled":true},{"name":"linkedin","url":"https://www.linkedin.com/sharing/share-offsite/?url=http%3a%2f%2fwww.spglobal.com%2fmarketintelligence%2fen%2fmi%2fresearch-analysis%2f14122016-Equities-Corporate-bond-lending-and-liquidity-risk.html","enabled":true},{"name":"email","url":"?subject=Corporate bond lending and liquidity risk&body=http%3a%2f%2fwww.spglobal.com%2fmarketintelligence%2fen%2fmi%2fresearch-analysis%2f14122016-Equities-Corporate-bond-lending-and-liquidity-risk.html","enabled":true},{"name":"whatsapp","url":"https://api.whatsapp.com/send?text=Corporate+bond+lending+and+liquidity+risk http%3a%2f%2fwww.spglobal.com%2fmarketintelligence%2fen%2fmi%2fresearch-analysis%2f14122016-Equities-Corporate-bond-lending-and-liquidity-risk.html","enabled":true}]}, {"name":"rtt","enabled":true,"mobdesc":"Top"}
]}


