Customer Logins
Obtain the data you need to make the most informed decisions by accessing our extensive portfolio of information, analytics, and expertise. Sign in to the product or service center of your choice.
Customer Logins
ECONOMICS COMMENTARY
Nov 14, 2017
Eurozone PMI and EC sentiment surveys compared
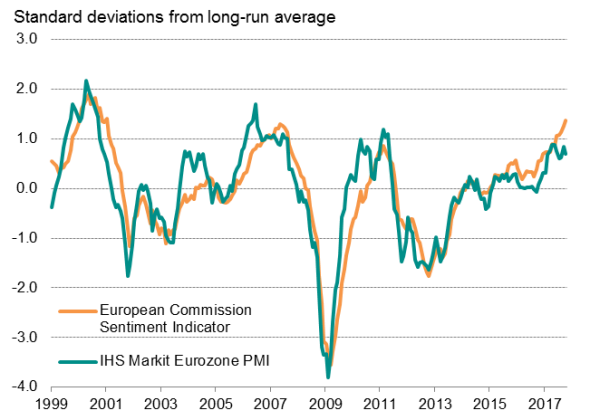
Eurozone survey indicators are giving conflicting signals. The European Commission's headline survey indicator hit a ten-year high in October, but at the same time the IHS Markit Eurozone PMI survey dropped slightly. Although the October PMI fell just short of six-and-a-half year highs seen in the second quarter, the latest reading was in line with the elevated average reading seen in the third quarter.
Eurozone business surveys

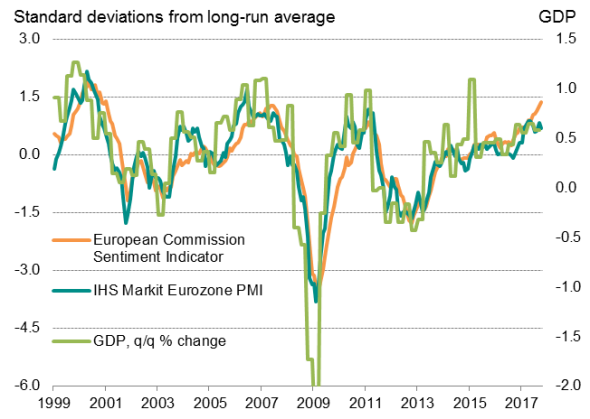
The difference in the GDP implications from the two surveys is significant. The PMI surveys have sent a signal of quarterly GDP growth moderating from just over 0.7% in the second quarter to just over 0.6% in the third quarter and October. In contrast, the EC surveys have indicated a continual acceleration of growth over the past year, suggesting GDP growth rose to 0.8% in the third quarter and further into the fourth quarter, with the October reading pointing to 0.9% growth[1].
The PMI appears to have been the more accurate so far this year (Eurostat data showed GDP growth of 0.7% and 0.6% in the second and third quarters respectively), and historically the PMI has a higher correlation with GDP than the EC surveys. The correlation of the PMI against GDP is 0.84, (compared with a monthly interpolation of the GDP data between 1999 and 2017). By comparison, the correlation for the EC survey over the same period is 0.73.
The PMI also appears to act as a leading indicator of the EC survey, as illustrated by the correlation between the two surveys rising to 0.92 when the PMI acts with a lead of two months, up from a coincident correlation of 0.88. The leading indicator property of the PMI is clearly visible at times of peak turning points.
Eurozone business surveys and GDP

Sources: IHS Markit, EC, Datastream
'Soft' v 'hard' survey data
The divergence between the surveys, and the lead of the PMI over the EC survey indicator, can be explained by the fact that they are measuring different things. Crucially, although both surveys track a variety of similar variables, there is a fundamental difference in the way questions are phrased.
The PMI survey tracks actual business conditions. The headline index is derived from a question asking companies to compare their actual level of production (or business activity, in the case of the service sector) at mid-month with the situation one month ago. This is not a measure of confidence or any other opinion of business well-being. It simply reflects what's really being produced from one month to the next.
The EC survey, on the other hand, features a variety of opinion-based questions from which an overall "Economic Sentiment" indicator is produced. For example, the EC survey asks if order books are "more than sufficient", "sufficient" or "not sufficient".
Responses to the EC survey questions can therefore clearly vary depending on other factors. In the example given above, a company responding to the EC survey's order book question will need to take into account both inflows of new orders and the company's capacity utilisation rate. Customer demand for the company's products or services may have fallen in the current month, but because the firm might have a large backlog of uncompleted orders, it will still be saying that its order books are "sufficient".
The PMI survey, in contrast, just measures actual inflows of new orders. A separate question is asked in relation to backlogs of work.
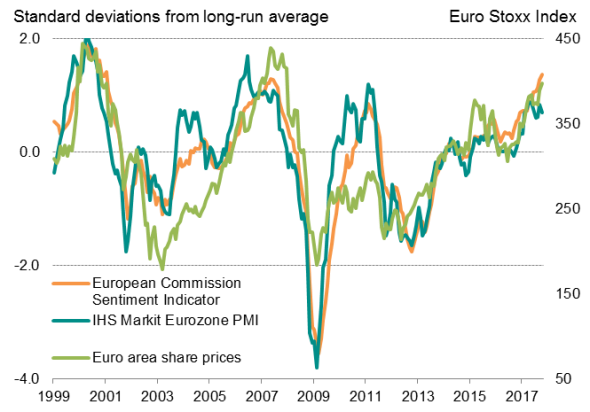
Many EC survey questions are also deliberately subjective, requiring a respondent's interpretation or "assessment" of the current business situation. Thus, while the PMI survey responses reflect a "hard" objective measure of each specific business metric (whether something such as output or selling prices have risen or fallen in any given month requires no opinion on behalf of the respondent), the EC survey responses are open to influence by other factors relating to business confidence, not least stock market performance and political stability. For example, the current elevated level of the EC survey may therefore potentially reflect record stock market valuations (in a similar situation to 2007, when the EC survey continued to rise alongside higher share prices after the PMI had already peaked).
Eurozone business surveys and share prices

Given the methodological differences between the two surveys, it makes intuitive sense that the PMI survey will have a closer correlation with hard economic data, such as gross domestic product, than the EC survey.
[1] Implied GDP growth rates calculated by regression analysis with the respective survey indicator as the sole explanatory variable of quarterly GDP growth from 1998 to 2017.
{"items" : [
{"name":"share","enabled":true,"desc":"<strong>Share</strong>","mobdesc":"Share","options":[ {"name":"facebook","url":"https://www.facebook.com/sharer.php?u=http%3a%2f%2fwww.spglobal.com%2fmarketintelligence%2fen%2fmi%2fresearch-analysis%2f14112017-economics-eurozone-pmi-and-ec-sentiment-surveys-compared.html","enabled":true},{"name":"twitter","url":"https://twitter.com/intent/tweet?url=http%3a%2f%2fwww.spglobal.com%2fmarketintelligence%2fen%2fmi%2fresearch-analysis%2f14112017-economics-eurozone-pmi-and-ec-sentiment-surveys-compared.html&text=Eurozone+PMI+and+EC+sentiment+surveys+compared","enabled":true},{"name":"linkedin","url":"https://www.linkedin.com/sharing/share-offsite/?url=http%3a%2f%2fwww.spglobal.com%2fmarketintelligence%2fen%2fmi%2fresearch-analysis%2f14112017-economics-eurozone-pmi-and-ec-sentiment-surveys-compared.html","enabled":true},{"name":"email","url":"?subject=Eurozone PMI and EC sentiment surveys compared&body=http%3a%2f%2fwww.spglobal.com%2fmarketintelligence%2fen%2fmi%2fresearch-analysis%2f14112017-economics-eurozone-pmi-and-ec-sentiment-surveys-compared.html","enabled":true},{"name":"whatsapp","url":"https://api.whatsapp.com/send?text=Eurozone+PMI+and+EC+sentiment+surveys+compared http%3a%2f%2fwww.spglobal.com%2fmarketintelligence%2fen%2fmi%2fresearch-analysis%2f14112017-economics-eurozone-pmi-and-ec-sentiment-surveys-compared.html","enabled":true}]}, {"name":"rtt","enabled":true,"mobdesc":"Top"}
]}


