Customer Logins
Obtain the data you need to make the most informed decisions by accessing our extensive portfolio of information, analytics, and expertise. Sign in to the product or service center of your choice.
Customer Logins
CREDIT COMMENTARY
Apr 04, 2016
Leveraged loans enjoy best quarter since 2012
Leveraged loans returned from the abyss to post their best quarter in three years, and investors have been quick to gain exposure.
- Markit iBoxx USD Liquid Leveraged Loans Index sees best quarterly return since Q3 2012
- The best performing sectors during the quarter were Energy and Healthcare
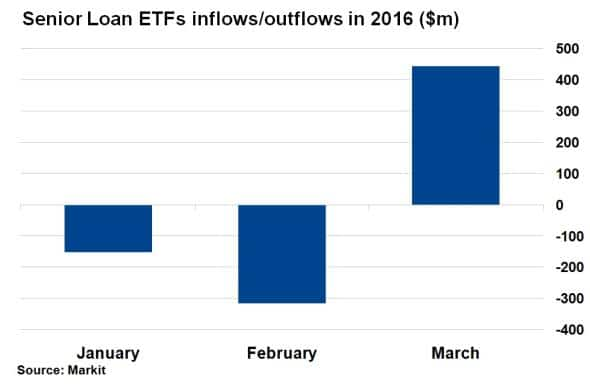
- Leveraged loans ETFs had $444m of inflows in March, a 7.88% increase in total AUM
View the full quarterly loans market report.
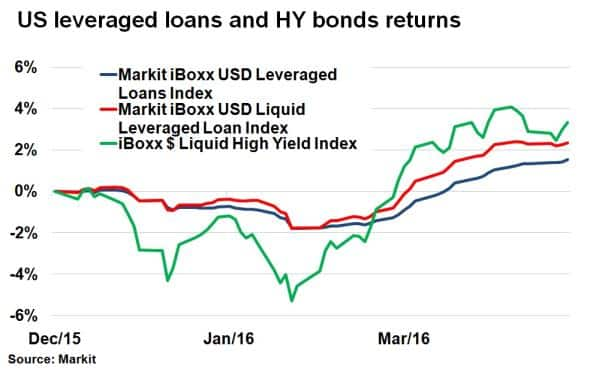
After a volatile start to 2016, investor demand for leveraged loans returned in Q1 as risky assets came back into favour. The Markit iBoxx USD Liquid Leveraged Loans Index ended the quarter up 2.35% on a total return basis, the best quarterly return since Q3 2012.
March rally
Leveraged loans witnessed a rather dramatic turnaround across the first quarter. The asset class saw returns tumble during the second half of 2015 in a trend which continued into the New Year. Factors contributing to the negative sentiment included falling commodity prices, tighter monetary conditions in the US, idiosyncratic risk and heightened global asset volatility.
The riskiest assets were hit hardest and the Markit iBoxx USD Liquid Leveraged Loans Index experienced four consecutive months of negative returns (November through February). At one point in February, leveraged loans were down nearly 2% on a total return basis. Similarly, US high yield (HY) bonds, as represented by the Markit iBoxx USD Liquid High Yield Index, were down nearly 5%.

However, a change in sentiment saw the Markit iBoxx USD Liquid Leveraged Loans Index rally in spectacular fashion. It returned 2.19% in March, the best month since October 2011. It also meant that the quarter ended up 2.35%, the best in three years. The broader Markit iBoxx USD Leveraged Loan Index ended the quarter up 1.52%, having been down nearly 2% in mid-February.
Energy and Healthcare lead
According to Markit's Loan pricing service, the rally in leveraged loans was broad based among rating and maturity cohorts, although the longest 7-yr tenor saw the biggest percentage change in average loan spread during the quarter. 7-yr BB rated loans saw a 12.72% improvement, with average spreads now at Libor +390bps, while the lowest rated CCC leveraged loans saw a 11.82% change at the 7-yr tenor, although spreads remain above Libor +1000bps.
North American sectors broadly outperformed their European counterparts across most sector and ratings. The best performing sector during the quarter was Healthcare, which saw its BB+ rated North American leveraged loans tighten 21bps. The bounce in crude oil prices also boded well for the Energy sector, with BB+ and BB- leveraged loans in North America tightening 15bps and 13bps respectively. The riskiest loans (CCC+) continued to struggle however, with most sectors seeing significant spread widening across the quarter.
Investor sentiment turns

The new found risk on sentiment in March enticed investors to add to their risk exposure through leveraged loans and US HY bond exchange traded funds (ETFs). $444m of new money flowed into ETFs tracking US leveraged loans, a 7.88% increase in assets under management. However, March's positive flows were not enough to cancel out the outflows seen in January and February, as the first quarter of 2016 ended with overall outflows. Investors much preferred US HY bonds, whose ETFs saw over $7bn of inflows across the quarter.
Neil Mehta, Analyst, Fixed Income, Markit
Tel: +44 207 260 2298
Neil.Mehta@markit.com
S&P Global provides industry-leading data, software and technology platforms and managed services to tackle some of the most difficult challenges in financial markets. We help our customers better understand complicated markets, reduce risk, operate more efficiently and comply with financial regulation.
This article was published by S&P Global Market Intelligence and not by S&P Global Ratings, which is a separately managed division of S&P Global.
{"items" : [
{"name":"share","enabled":true,"desc":"<strong>Share</strong>","mobdesc":"Share","options":[ {"name":"facebook","url":"https://www.facebook.com/sharer.php?u=http%3a%2f%2fwww.spglobal.com%2fmarketintelligence%2fen%2fmi%2fresearch-analysis%2f04042016-Credit-Leveraged-loans-enjoy-best-quarter-since-2012.html","enabled":true},{"name":"twitter","url":"https://twitter.com/intent/tweet?url=http%3a%2f%2fwww.spglobal.com%2fmarketintelligence%2fen%2fmi%2fresearch-analysis%2f04042016-Credit-Leveraged-loans-enjoy-best-quarter-since-2012.html&text=Leveraged+loans+enjoy+best+quarter+since+2012+%7c+S%26P+Global+","enabled":true},{"name":"linkedin","url":"https://www.linkedin.com/sharing/share-offsite/?url=http%3a%2f%2fwww.spglobal.com%2fmarketintelligence%2fen%2fmi%2fresearch-analysis%2f04042016-Credit-Leveraged-loans-enjoy-best-quarter-since-2012.html","enabled":true},{"name":"email","url":"?subject=Leveraged loans enjoy best quarter since 2012 | S&P Global &body=http%3a%2f%2fwww.spglobal.com%2fmarketintelligence%2fen%2fmi%2fresearch-analysis%2f04042016-Credit-Leveraged-loans-enjoy-best-quarter-since-2012.html","enabled":true},{"name":"whatsapp","url":"https://api.whatsapp.com/send?text=Leveraged+loans+enjoy+best+quarter+since+2012+%7c+S%26P+Global+ http%3a%2f%2fwww.spglobal.com%2fmarketintelligence%2fen%2fmi%2fresearch-analysis%2f04042016-Credit-Leveraged-loans-enjoy-best-quarter-since-2012.html","enabled":true}]}, {"name":"rtt","enabled":true,"mobdesc":"Top"}
]}


