Customer Logins
Obtain the data you need to make the most informed decisions by accessing our extensive portfolio of information, analytics, and expertise. Sign in to the product or service center of your choice.
Customer Logins
EQUITIES COMMENTARY
Feb 04, 2016
Sector rotation rises in popularity
US sector ETFs have gained popularity in recent months as prevailing economic winds disperse returns across sectors, encouraging increased adoption of sector rotation strategies.
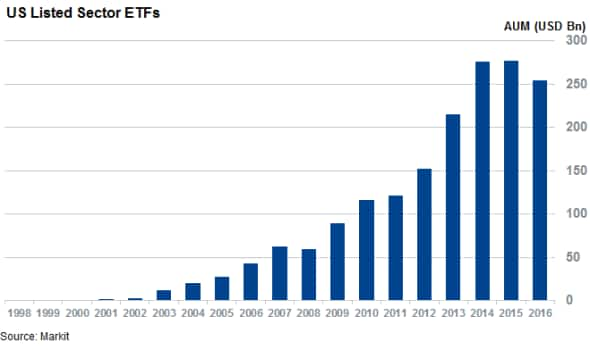
- US sector ETFs managed to pull in a record $277bn at the end of 2015
- Utilities surge in popularity in 2016 while technology and healthcare funds are shunned
- The newly launched US sector rotation model ranks healthcare, financials and industrials as sectors to best benefit from current economic environment
Please contact us to get a copy of the Markit Research Signals US Sector Rotation* white paper
Sector investing though sector-tracking ETFs has surged in popularity in the last few years as investors seek a more focused alternative the broad brush investment approaches of passive index tracking while maintaining a level of easily available diversification that has made ETFs so popular. US sector ETFs, which manage arround 90% of all sector based ETF assets, saw their AUM base suge to a record $277bn at the end of last year. This represents a doubling of the asset base managed by the roughly 300 such funds since the end of 2011.
Investors shifting positions
The rising popularity of sector ETFs has also seen a growth in sector rotation plays as investors shift positions between products. This is evidenced in the first five trading weeks of the year where investors withdrew a net $5.5bn from funds. While these outflows are significant, the gross fund flows between sectors were nearly twice as high at $9.5bn. Essentially, the net fund flows in and out sector funds hide a large part of the views expressed by investors through sector ETFs.
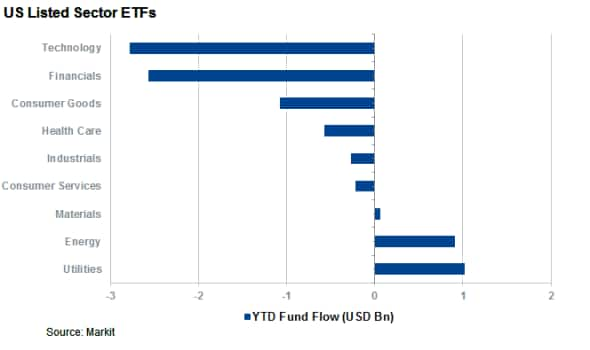
The current trend expressed by investors through sector ETF fund flows so far this year is very much a risk off strategy as utilities funds, arguably the most defensive sector, lead the inflow table with $1bn of net inflows in the first six weeks of the year.
Energy funds have also continued to prove popular with investors over the last 18 months, a trend that shows no signs of slowing down in the New Year as these funds have seen $900m of inflows since the start of 2016. This takes their total inflow tally since the start of the Q3 2014 to $14bn, by far the most out of any sector over this period.
Formerly popular financials and technology funds have seen a reversal of fortunes and now sit at the bottom of the net fund flow rankings as investors have pulled $2.5bn and $2.7bn from the sectors respectively.
The ETF industry has looked to capitalize on this sector rotation trend by launching strategy funds that rotate between ETFs based on proprietary models. The strategy has rung a bell with investors as the First Trust Dorsey Wright Focus 5 ETF has seen its AUM base swell to a high of $4.8bn at the end of last year. While the fund has since seen outflows since the start 2016, the $3.8bn underscores the popularity of the strategy.
Sector Rotation model
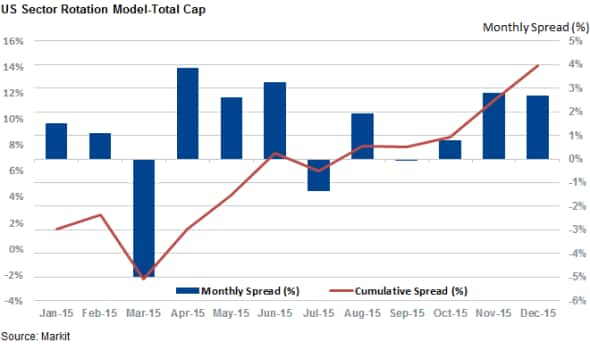
Sector rotation can also deliver positive total returns in times of volatility. The newly launched Markit Research Signals US Sector Rotation model, which is a long short model based on investing in the three best (and worst) ranked US sectors based on four modules built on fundamental, macroeconomic and investor sentiment factors*, has returned over 12% in 2015.
Sectors currently ranked favourably by the model include financials, healthcare and industrials. The inclusion of the top two sectors is driven in part by their buoyant rankings in the Markit Sector PMI survey, a key model driver.
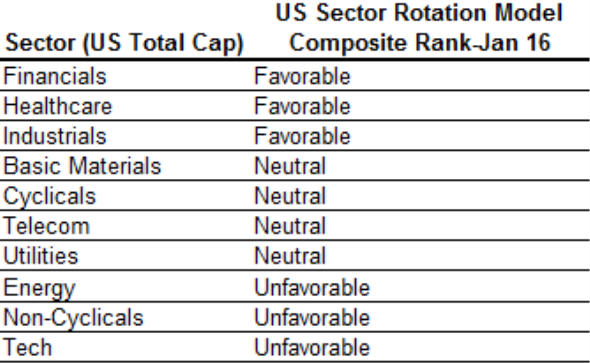
On the other side of the ranking, the energy, non-cyclical sector and technology sectors feature among the sectors to avoid. Energy is the standout negative sector owing to the fact that it features among the worst ranked group in all but one of the model's 13 factors.
*Appendix: Sector Rotation Model
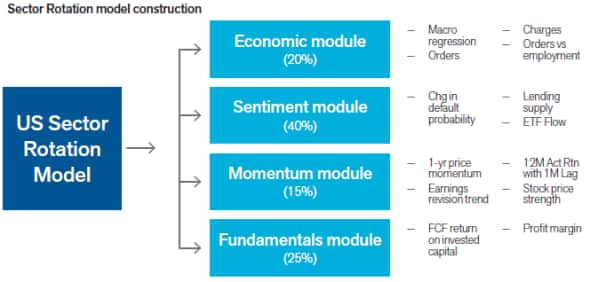
The US Sector Rotation model consists of four main modules - Economic, Sentiment, Momentum and Fundamentals. Markit's PMI data is a key component of the strategy, as it has been an accurate and valuable leading indicator for economic conditions versus the less timely official information.
Combined with the additional style and market sentiment components, the model creates a systematic allocation strategy incorporating the business activity to take advantage of equity returns in growing sectors and underweight or short contracting sectors.
In general, favourable (unfavourable) signals from the composite score are assigned to the top 3 (bottom 3) sectors. The figure bellow displays the model construction and the modules driving it.
Simon Colvin | Research Analyst, Markit
Tel: +44 207 264 7614
simon.colvin@markit.com
S&P Global provides industry-leading data, software and technology platforms and managed services to tackle some of the most difficult challenges in financial markets. We help our customers better understand complicated markets, reduce risk, operate more efficiently and comply with financial regulation.
This article was published by S&P Global Market Intelligence and not by S&P Global Ratings, which is a separately managed division of S&P Global.
{"items" : [
{"name":"share","enabled":true,"desc":"<strong>Share</strong>","mobdesc":"Share","options":[ {"name":"facebook","url":"https://www.facebook.com/sharer.php?u=http%3a%2f%2fwww.spglobal.com%2fmarketintelligence%2fen%2fmi%2fresearch-analysis%2f04022016-Equities-Sector-rotation-rises-in-popularity.html","enabled":true},{"name":"twitter","url":"https://twitter.com/intent/tweet?url=http%3a%2f%2fwww.spglobal.com%2fmarketintelligence%2fen%2fmi%2fresearch-analysis%2f04022016-Equities-Sector-rotation-rises-in-popularity.html&text=Sector+rotation+rises+in+popularity","enabled":true},{"name":"linkedin","url":"https://www.linkedin.com/sharing/share-offsite/?url=http%3a%2f%2fwww.spglobal.com%2fmarketintelligence%2fen%2fmi%2fresearch-analysis%2f04022016-Equities-Sector-rotation-rises-in-popularity.html","enabled":true},{"name":"email","url":"?subject=Sector rotation rises in popularity&body=http%3a%2f%2fwww.spglobal.com%2fmarketintelligence%2fen%2fmi%2fresearch-analysis%2f04022016-Equities-Sector-rotation-rises-in-popularity.html","enabled":true},{"name":"whatsapp","url":"https://api.whatsapp.com/send?text=Sector+rotation+rises+in+popularity http%3a%2f%2fwww.spglobal.com%2fmarketintelligence%2fen%2fmi%2fresearch-analysis%2f04022016-Equities-Sector-rotation-rises-in-popularity.html","enabled":true}]}, {"name":"rtt","enabled":true,"mobdesc":"Top"}
]}


