Loan market proves resilient in Q2
The second quarter has presented a number of challenges for fixed income investors, but the leveraged loan market has proved to be one of the few bright spots.
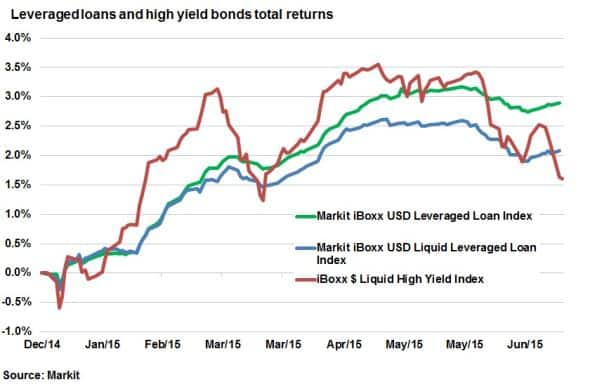
- Markit iBoxx Leveraged Loan index up 0.78% in Q2, beating high yield bonds by 2.1%
- ETFs that invest in leveraged loans have managed to preserve recent inflows
- Secondary loan market settlement time has been dropping, with buoyant volumes
View the full quarterly loans market report.
One of the unexpected consequences of the recent bond market volatility has been the fact that most of the downside has occurred in investment grade and government bonds. This runs contrary to accepted market theory which dictates that these relatively safe investments should ride out periods of volatility. But in this latest case, the extra yield offered by speculative bonds seems to be too good to pass up for some investors.
This phenomenon has seen speculative high yield grade bonds outperform their investment grade peers by 3.1% over the second quarter. This outperformance is only relative however as high yield bonds are down by over 1.4% for the second quarter on a total return basis.
Leverage loans outperform
Leveraged loans have been one of the few areas in the fixed income universe that have been able to provide investors with positive total return over the last three months.

Leveraged loans, which are syndicated loans made out to poor credit quality borrowers, have managed to return 0.78% over the last three months according to the Markit iBoxx Leveraged Loan Index. This positive total return contrasts with a 1.42% fall seen in high yield bonds, as gauged by the Markit iBoxx Liquid $ High Yield index.
Liquid loans, which make up the Markit iBoxx Liquid Leveraged Loan index, have not performed as well but have still managed to return 0.28% over the past three months.
Although leveraged loans remain some way off from the recent yearly highs seen in the closing week of May, the asset class has proved much less volatile than bonds over the past six months.
This lower volatility has been driven by the fact that loans trade on a spread to Libor; isolating them from rises in benchmark interest rates which have been the cause of most of the recent bond volatility.
This positive performance also holds well on a longer timeframe, as leverage loans are up 2.90% year to date; nearly twice the 1.6% total returns delivered by high yield bonds.
ETF investors take note
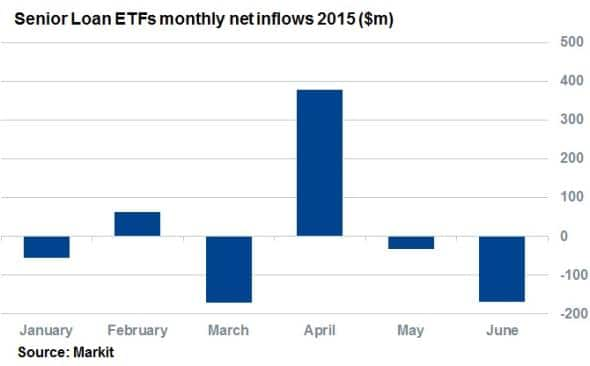
This outperformance has not gone unnoticed by ETF investors as the funds which track the asset class have seen over $160m of net inflows over the quarter. This marks a striking contrast to the $3bn that has poured out of high yield ETFs over the same period.

While senior loan ETFs saw a slight selloff in June when investors withdrew $168m, this outflow only represents 2.4% of the assets managed by these funds.
High yield bonds have fared much worse in comparison, with investors withdrawing $3bn, which represents 5.9% of the assets managed by these funds.
CLO implications
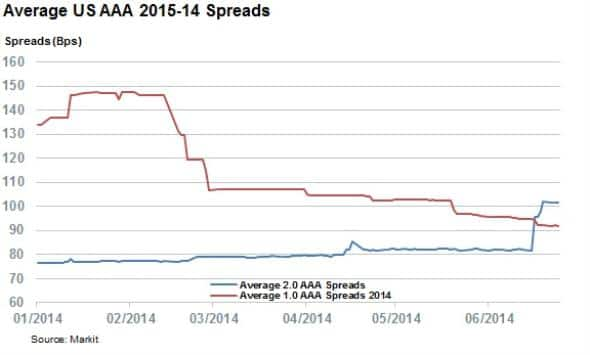
The selloff seen in the closing weeks of the quarter has also been seen in CLO paper, which are repackaged loans, as demonstrated by the widening of AAA spreads. US 2.0 AAA spreads have widened by 20bps in the closing two weeks of the year to pass the 100bps mark.

This could be driven by the pending Volcker regulation as non-Volcker compliant deals are generally wider than that those of compliant AAAs, this may present opportunities for non-bank investors which are less impacted by the regulation.
Settlement times down
Secondary market settlement times, which are perceived as a major operational hurdle to investment in leveraged loans, have also been coming down over the last six months.
The manual nature of the loan market settlement process means deals take much longer to settle than conventional bond transactions in the secondary market, but the industry has been taking steps to address this issue and settlement times have continued to fall over the last couple of years.
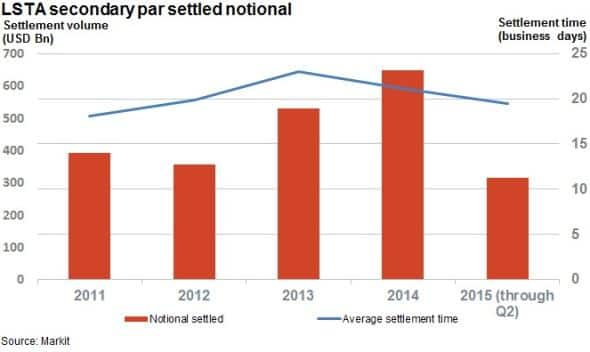
Last year saw the average settlement time for loans through Markit Loan Settlement fall from 23 business days to 21.1. Settlement times for trades in the first six months of the year have continued to fall, with deals now taking on average 19.4 business days to clear.

This comes despite the fact that volumes over this time period have been relatively strong, with the aggregate settled notional jumping by 22% in 2014 to $647bn. Volumes this year have been equally healthy, with $310bn settled in the first six months of the year; a number that is on track to match last year's total.
Simon Colvin, Research Analyst, Markit
Tel: +44 207 264 7614
simon.colvin@markit.com
S&P Global provides industry-leading data, software and technology platforms and managed services to tackle some of the most difficult challenges in financial markets. We help our customers better understand complicated markets, reduce risk, operate more efficiently and comply with financial regulation.
This article was published by S&P Global Market Intelligence and not by S&P Global Ratings, which is a separately managed division of S&P Global.