S&P Global Offerings
Featured Topics
Featured Products
Events
S&P Global Offerings
Featured Topics
Featured Products
Events
S&P Global Offerings
Featured Topics
Featured Products
Events
Banking & Capital Markets
Economy & Finance
Energy Transition & Sustainability
Technology & Innovation
Podcasts & Newsletters
Banking & Capital Markets
Economy & Finance
Energy Transition & Sustainability
Technology & Innovation
Podcasts & Newsletters
S&P Global Offerings
Featured Topics
Featured Products
Events
Blog — 3 Mar, 2021
Highlights
According to the Business and Sustainable Development Commission, putting the SDGs at the heart of the world’s economic strategy could unlock US$12 trillion in opportunities and 380 million jobs a year by 2030.
The majority of EU Taxonomy-aligned revenues are generated in the manufacturing sector, followed by construction and real estate and information and communications.
Impact of Sustainable Investments
This piece looks at the progress that is being made towards achieving the 17 United Nations Sustainable Development Goals (SDGs) that were launched in 2015. Formally adopted by 193 countries, the SDGs outline a set of objectives to be achieved by 2030 that aim to end poverty, hunger and inequality, while tackling climate change, improving health and education and spurring economic growth. According to the Business and Sustainable Development Commission, putting the SDGs at the heart of the world’s economic strategy could unlock US$12 trillion in opportunities and 380 million jobs a year by 2030.[1]
We also review important steps being taken in Europe to establish performance thresholds for economic activities that contribute to select environmental objectives in order to help market participants gain access to green financing through the EU Taxonomy for Sustainable Activities. We close with a focus on the incredible growth of green bonds that reached a new global record in 2019, providing insight into the regions that are dominating this activity and the industries that are benefitting.
Half of Revenues are Generated by Business Activities Supporting SDGs
% OF COMPANIES SUPPORTING SDGs
The SDGs outline a set of objectives to be achieved by 2030 that aim to end poverty, hunger and inequality, while tackling climate change, improving health and education, and strengthening institutions globally. In contrast to the earlier Millennium Development Goals, the SDGs not only emphasize the role of government and non-government sectors, but of businesses to operate responsibly and pursue opportunities to solve societal challenges.
SDG Positive Impact Alignment refers to the positive contribution a company may be making to the SDGs by directing its business model towards priorities that help achieve any of the goals. Most commonly, this is through the sale of SDG-aligned products and services.
Currently, 53% of revenues of the 500 largest U.S. companies and 49% of revenues of the 1,200 largest global companies are generated in business activities that support SDGs. The three most supported SDGs for U.S. companies are SDG 9: Industry, innovation, and infrastructure (11%), SDG 17: Partnerships (9%) and SDG 3: Good health and well-being (6%). While SDG 9 and 17 are also in the top three when looking globally, SDG 8: Decent work and economic growth is the top supported across global companies (8%). SDG 4: Quality education, 14: Life below water and 15: Life on land receive almost no support, both in the U.S. and globally.
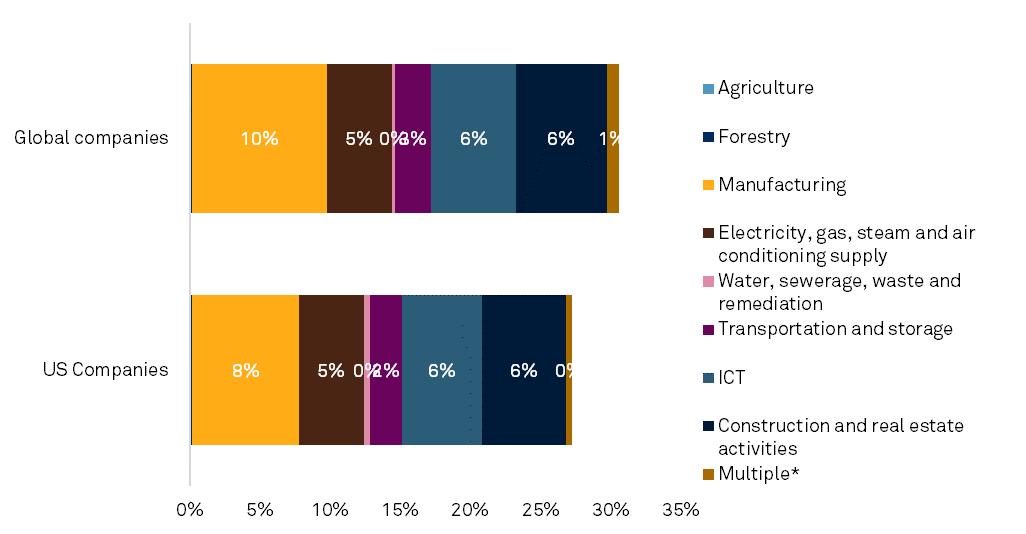
Nearly a Third of Revenues by U.S. and Global Companies Align with the EU Taxonomy for Sustainable Activities
EU TAXONOMY REVENUE SHARE BY SECTOR

SOURCE: S&P GLOBAL, 2020
In March 2018, the European Commission adopted an action plan on sustainable finance as part of a strategy to integrate ESG considerations into its financial policy framework and mobilize finance for sustainable growth. Two months later, the Commission released the first legislative package under the action plan and established a Technical Expert Group on Sustainable Finance (TEG) to inform its development. One of the proposals under the legislative package was the development of a unified EU classification system, or EU Taxonomy (“Taxonomy”) that would define which economic activities are environmentally sustainable. In March 2020, the TEG published its final report that outlined recommendations on the design and implementation of the Taxonomy.
The taxonomy is a tool that can help companies and investors navigate the transition to a low-carbon, resilient and resource-efficient economy. It sets performance thresholds (referred to as technical screening criteria) for economic activities that make a substantive contribution to one of six environmental objectives: climate change mitigation, climate change adaptation, sustainable and protection of water and marine resources, transition to a circular economy, pollution prevention/control and protection and restoration of biodiversity and ecosystems. The performance thresholds will help companies, project promoters and issuers access green financing to improve their environmental performance, as well as help identify activities that are already environmentally friendly. The aim is to grow low-carbon sectors, while decarbonizing high-carbon ones.
The taxonomy outlines 70 business activities linked to seven macro sectors.[2] These include transition activities that either have low-carbon intensity and direct carbon mitigation potential (e.g., renewable energy), or relatively higher carbon intensity, but significant carbon mitigation potential over time (e.g., steel manufacturing). It also includes enabling activities that could support carbon emission reductions in other sectors (e.g., wind turbine manufacturing).
A 2019 analysis by Trucost showed that nearly 27% of revenues generated by the 500 largest U.S. companies and 31% of revenues generated by the 1,200 largest global companies were aligned to the EU Taxonomy for Sustainable Activities. The majority of EU Taxonomy-aligned revenues are generated in the manufacturing sector, followed by construction and real estate and information and communications.
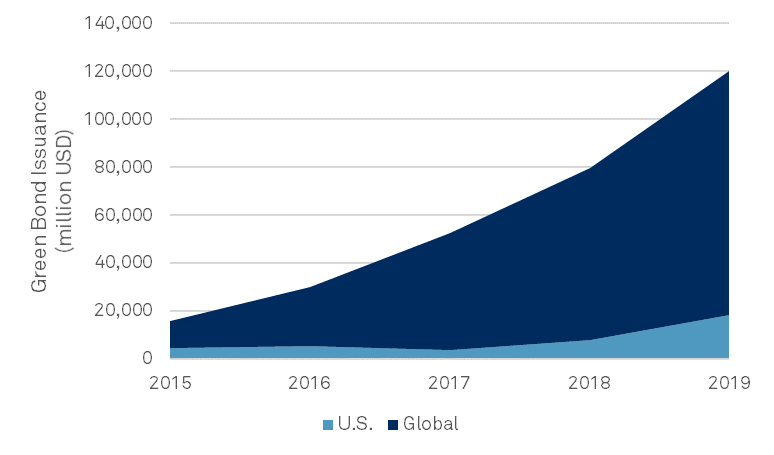
Global Issuances of Green Bonds Grew Sharply in the Last Five Years
CORPORATE GREEN BOND ISSUANCE (MILLION USD)

SOURCE: CLIMATE BONDS INITIATIVE, 2020
Green issuance and investment is on a clear upward trajectory, propelled by the 2015 Paris Agreement and the impetus it created to finance $1 trillion a year in investments for renewable energy and other initiatives to limit global warming. Green bonds, designed to channel funds to environmentally friendly projects, reached a new global record of over USD$255 billion in issuances in 2019, a 51% growth over the previous year,[3] with corporate green bonds accounting for nearly $120 billion of this total. The majority of the proceeds were used for energy, building and transport, in that order.
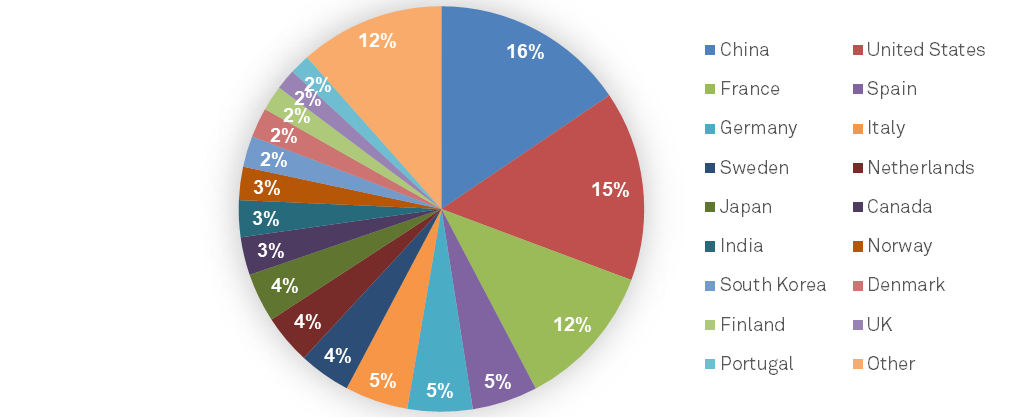
In Aggregate, European Firms Dominate Issuances of Green Bonds
GREEN BOND ISSUANCE MILLION USD

SOURCE: CLIMATE BONDS INITIATIVE, 2020
A number of corporate sectors have had reasonable success issuing green debt, with shipping, autos, airlines, cement and, selectively, the metals, mining and hydrocarbon (i.e., oil and gas, chemicals, etc.) industries all playing an important role in the transition to sustainability.[4] Corporate green bonds were issued from 59 countries in 2019. China accounted for 16% of the total by value, followed closely by the U.S. (15%) and France (13%). In aggregate, however, Europe accounted for nearly 50% of the total value.
Although corporate debt issuers in North America are increasingly willing to consider sustainable financing as part of their capital funding, green bonds are still only a very small share of the mix. According to S&P Global Ratings,5 one reason why issuance has not been significant in the U.S. is because approximately 95% of green issuers are investment-grade companies where spreads between rating categories are typically narrower, especially in a low interest rate environment. The spread difference between green and vanilla bonds will likely be larger as interest rates rise and a broader swath of the credit spectrum issues green bonds.
[1] A release from the Business and Sustainable Development Commission, January 16, 2017, http://businesscommission.org/news/release-sustainable-business-can-unlock-at-least-us-12-trillion-in-new-market-value-and-repair-economic-system.
[2] Using the Nomenclature of Economic Activities (NACE), the statistical classification of economic activities in the EU.
[3] “2019 Green Bond Market Summary”, Climate Bonds Initiative, February 2020, www.climatebonds.net/files/reports/2019_annual_highlights-final.pdf.
[4] “Why Corporate Green Bonds Have Been Slow to Catch On in the U.S”, S&P Global, February 22, 2020, www.spglobal.com/en/research-insights/articles/why-corporate-green-bonds-have-been-slow-to-catch-on-in-the-u-s.
Blog
Blog
