S&P Global Offerings
Featured Topics
Featured Products
Events
S&P Global Offerings
Featured Topics
Featured Products
Events
S&P Global Offerings
Featured Topics
Featured Products
Events
Banking & Capital Markets
Economy & Finance
Energy Transition & Sustainability
Technology & Innovation
Podcasts & Newsletters
Banking & Capital Markets
Economy & Finance
Energy Transition & Sustainability
Technology & Innovation
Podcasts & Newsletters
S&P Global Offerings
Featured Topics
Featured Products
Events
Blog — 22 Feb, 2021
Highlights
Carbon pricing mechanisms are an important policy tool to reduce GHG emissions and direct capital towards cleaner energy and lower-carbon solutions.
Climate change physical risks are expected to vary widely across the globe. Existing hazards will likely increase in intensity in some regions, while other regions will become subject to hazards not previously experienced.
2020 is on track to become the warmest year yet on record, even without any major El Niño event(opens in a new tab) – a factor that has contributed to most prior record warm years.[1]
From wildfires to hurricanes, extreme weather conditions are starting to have a material impact on the global financial system. The Financial Stability Board’s Task Force on Climate-related Financial Disclosures (TCFD) recommends companies should evaluate two main categories of climate risk: transitional and physical. Transitional risks are associated with any market, policy, or technology disruption resulting from actions taken to limit climate risk by delivering the low carbon economy. One such action is putting a price on carbon. Physical risks are associated with intensifying climate-related weather events like droughts, floods, wildfires, hurricanes, water stress and heatwaves.
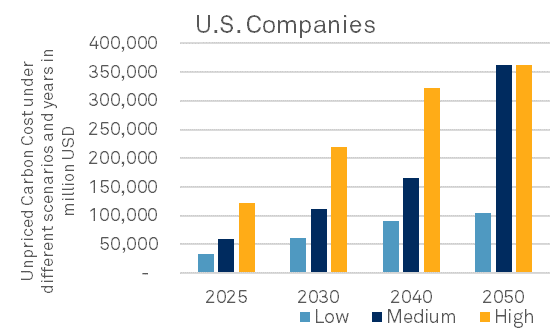
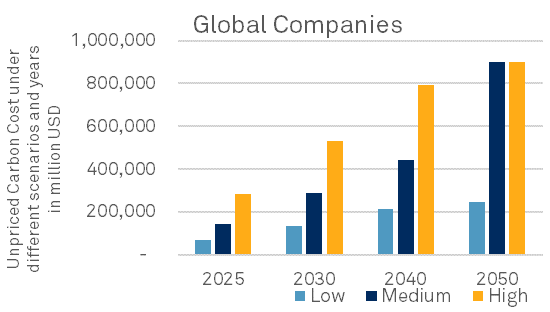
Hundreds of Billions in Unpriced Carbon Costs Expected by 2050
UNPRICED CARBON COST UNDER DIFFERENT SCENARIOS AND YEARS IN MILLION USD
Source: Trucost, 2020
Carbon pricing mechanisms are an important policy tool to reduce GHG emissions and direct capital towards cleaner energy and lower-carbon solutions. Globally, there are currently 57 carbon pricing schemes either in operation or scheduled for implementation at a regional, national, or sub-national level, covering approximately 20% of global GHG emissions.[2] According to the World Bank, however, both the amount of emissions covered by carbon pricing and the price levels are still too low to meet the objectives of the 2015 Paris Agreement to strengthen the global response to the threat of climate change by keeping a global temperature rise this century well below 2 degrees Celsius above pre-industrial levels and to pursue efforts to limit the temperature increase even further to 1.5 degrees Celsius. Carbon pricing policies are likely to ramp up as regions seek to achieve their Nationally Determined Contributions (NDCs) to reduce emissions and deliver on the Paris Agreement.
To help stakeholders navigate carbon pricing risk, Trucost has quantified current pricing schemes in over 130 regions together with potential future carbon pricing scenarios required to deliver the Paris Agreement. The dataset is used by companies to stress test their ability to absorb future costs and get ahead of carbon pricing risk. Investors typically apply the dataset at the portfolio level to assess portfolio earnings at risk and identify company outliers. Integral to this analysis is the quantification of an Unpriced Carbon Cost (UCC) – the difference between what a company pays for emitting carbon today and what it may pay in the future.
The UCC varies depending on the sector a company operates in and its geographical locations (i.e., where it emits). It also depends on the scenario and reference year chosen. Three scenarios are presented: Low, Moderate, and High. By 2050, both Moderate and High scenarios arrive at a price deemed to be sufficient to keep global warming to within 2°C above pre-industrial levels (in the former, action is delayed in the short term). The Low scenario is not 2°C aligned but assumes the implementation of the NDCs.
Under the High pricing scenario, the 500 largest U.S. companies face US$122 billion in UCC in 2025, equating to 11% of earnings. For the 1,200 largest global companies, that figure is approximately $284 billion, representing 13% of earnings. By 2050, the UCCs balloon to $363 billion and $898 billion for U.S. and global companies, respectively, under both the Moderate and High pricing scenario.
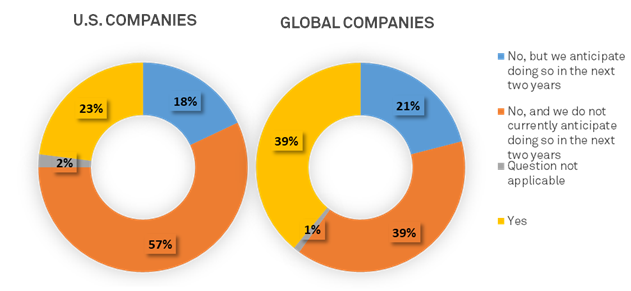
Minority of Companies Have Set Internal Carbon Prices, but More Plan to Do So in Next Two Years
% OF COMPANIES SETTING A CARBON PRICE
Source: Trucost, 2020
An internal carbon price places a monetary value on GHG emissions to inform low carbon business strategies. For example, by integrating internal carbon pricing into product development and supply chain decision making, companies can inform the business case for low carbon innovation and risk management. U.S. and global companies face significant monetary risks from carbon pricing policies, yet only 23% of U.S companies and 39% of global companies have set an internal carbon price. These figures are expected to increase by 18% in the U.S. and 21% globally in the next two years.
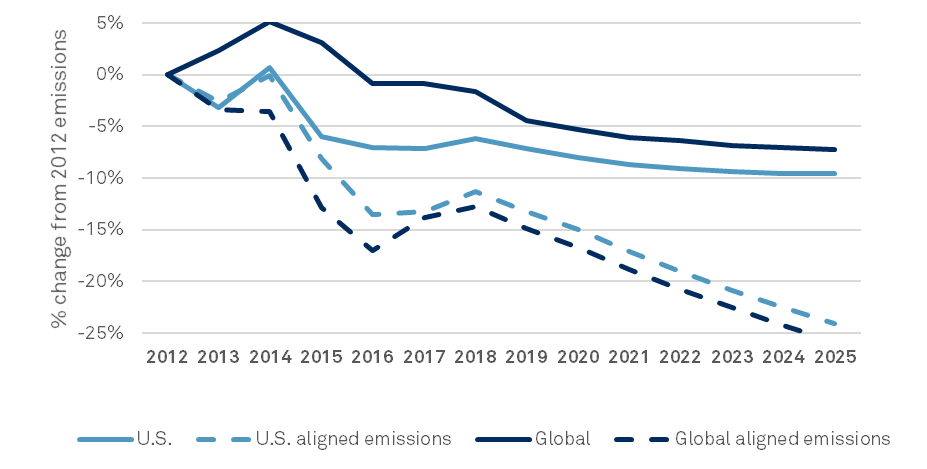
Significant Emissions Reductions Are Needed to Align With a 2 Degrees Celsius Scenario
% CHANGE FROM 2012 EMISSIONS
Source: Trucost, 2020
A Paris Alignment assessment looks at companies' alignment with the Paris Agreement goal to limit global warming to well below 2°C from pre-industrial levels. The approach taken by Trucost is a transition pathway assessment, which examines the adequacy of emissions reductions over time in meeting a 2°C carbon budget. For this analysis, a medium-term time horizon was applied, informed by seven years of historical data and seven years of projected future emissions.
The findings showed that U.S. companies are on a trajectory to fall short of the required reductions, achieving only a 10% decrease from a 2012 baseline by 2025 ; 60% short of the 24% reduction needed to align with the Paris Agreement goal of 2 degrees warming by 2025. Large global companies are on track to exceed a 3 degree warming pathway, achieving only a 7% reduction in carbon emissions from a 2012 baseline by 2025, 72% short of the 26% reduction needed to achieve the Paris Agreement goal of 2 degrees warming by 2025.
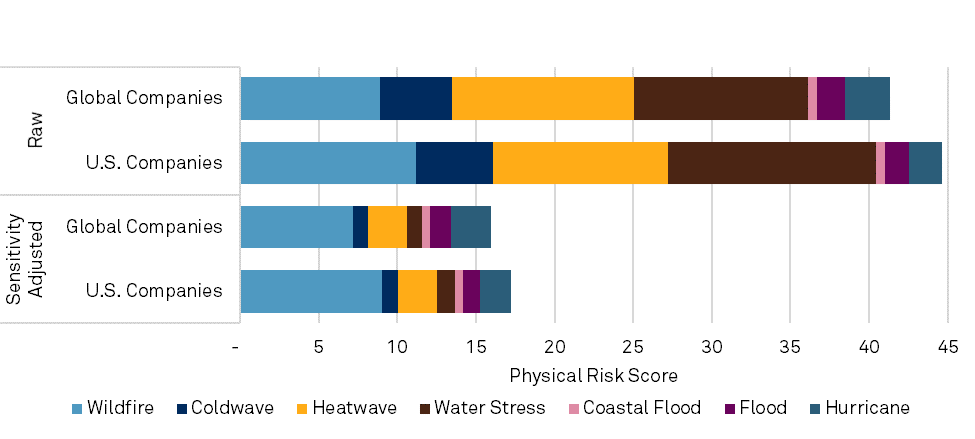
Heatwave and Water Stress Are Greatest Drivers of Physical Risk for Both U.S. and Global Companies
PHYSICAL RISK SCORE BY CLIMATE RISK INDICATOR IN 2050 UNDER RCP 8.5
Source: Trucost, 2020
Climate change physical risks are expected to vary widely across the globe. Existing hazards will likely increase in intensity in some regions, while other regions will become subject to hazards not previously experienced. These changes, combined with the increasingly global nature of corporate operations and supply chains, may present significant variation in the intensity and range of physical risk exposures across global capital markets.
Some sectors are more at risk than others, but it depends on the specific type of hazard in question. Certain predictions for rising sea levels, for example, show a possible change of 1.5 meters beyond 2100, which could affect a large portion of lower Manhattan and a great deal of real estate around the world. Heatwaves and wildfires, on the other hand, could have a serious impact on the power grid and electricity producers. In addition, floods and droughts could affect power stations, as well as farmers.
The Trucost Climate Change Physical Risk dataset provides detailed information to help understand the exposure of company-owned facilities and capital assets to climate-related physical impacts under different climate change scenarios and time intervals.
Trucost analyzed the average asset-level physical risk exposure of the 500 largest U.S. companies and 1,200 largest global companies under a High Climate Change scenario (the so-called RCP 8.5 global warming scenario(opens in a new tab)) by 2050, which would occur if fossil fuels continue to dominate and emissions continue to rise. Companies are scored from 1 to 100 for each of the seven risk types (water stress, wildfire, flood, heatwave, coldwave, hurricane and coastal flood). A score of 100 indicates the highest possible exposure and sensitivity to a given risk, while 1 indicates the lowest.
Findings showed that water stress, heatwaves and wildfires linked to increasing global average temperatures represent the greatest driver of physical risk across both U.S. and global companies. Under a High Climate Change scenario, nearly 95 percent of U.S. companies and 80 percent of global companies will face moderate physical risk (score > 33) by 2050. 44 percent of the 500 largest U.S companies and 30 percent of the 1,200 largest global companies own at least one asset located in an area facing high water stress risk. 13 percent and 17 percent of these U.S. and global companies, respectively, own at least one asset at high risk for wildfire.
Trucost also provides a sensitivity-adjusted physical risk score in order to reflect the potential materiality of events to an asset owner’s business. For example, businesses with high water dependency are more likely to be impacted by water scarcity, while businesses with high capital intensity are more likely to be impacted by wildfires or floods. Wildfire remains the most important physical risk for both U.S. and global companies when making these adjustments. However, the sensitivity adjusted physical risk score decreases significantly for both U.S. and global companies.
[1] “State of the climate: 2020 on course to be warmest year on record”, CarbonBrief, October 23, 2020, www.carbonbrief.org/state-of-the-climate-2020-on-course-to-be-warmest-year-on-record.
[2] “57 Carbon Pricing Initiatives Now in Place Globally, Latest World Bank Report Finds”, World Bank, June 7, 2019, www.worldbank.org/en/news/press-release/2019/06/07/57-carbon-pricing-initiatives-now-in-place-globally-latest-world-bank-report-finds.
BLOG
RESEARCH
