S&P Global Offerings
Featured Topics
Featured Products
Events
S&P Global Offerings
Featured Topics
Featured Products
Events
S&P Global Offerings
Featured Topics
Featured Products
Events
Banking & Capital Markets
Economy & Finance
Energy Transition & Sustainability
Technology & Innovation
Podcasts & Newsletters
Banking & Capital Markets
Economy & Finance
Energy Transition & Sustainability
Technology & Innovation
Podcasts & Newsletters
S&P Global Offerings
Featured Topics
Featured Products
Events
BLOG — Sep 15, 2022
This analytics article utilizes trade data published by S&P Global Market Intelligence - Global Trade Analytics Suite (GTAS)(opens in a new tab)
Key Observations
From a quarterly perspective, the most recent data for the second quarter of 2022 from S&P Global Market Intelligence - Global Trade Analytics Suite (GTAS)(opens in a new tab) point to positive year-on-year growth for exports as well as imports in almost all the top 10 reporting states.
It does not mean, however, that we cannot see a slowdown in the trade in the second quarter of 2022 for most of the reporting countries, apart from imports from India which had an impressive second quarter of 2022, as well as Brazil and Canada.
The adjusted PMI new exports orders readouts for the global manufacturing industry as well as services in June 2022 were below the benchmark value of 50.0 points - 48.0 and 48.2, respectively.
After growing at annual rates of 6.2% quarter on quarter in the fourth quarter of 2021 and 2.6% in the first quarter of 2022, world real GDP fell at a 1.8% rate in the second quarter. Recent data suggest the global economy is back on track, led by resilient emerging markets.
Changes in trade of the top 10 economies
From a quarterly perspective, the most recent data for the second quarter of 2022 from S&P Global Market Intelligence - Global Trade Analytics Suite (GTAS)(opens in a new tab) point to positive year-on-year growth for exports as well as imports in all the top 10 reporting states, apart from Japan, which marked 2.3% drop in export value in the second quarter of 2022. It does not mean, however, that we cannot see a slowdown in the trade in the second quarter of 2022 for most of the reporting countries, apart from imports from India which had an impressive second quarter of 2022 (49.6% growth y/y) and Brazil (34.4% y/y growth in imports) as well as Canada with growing dynamics for exports as well as imports (28.0% and 21.4% y/y growth, respectively).
As previously mentioned, Russia is not reporting data starting from February 2022 onwards, yet a tremendous drop in Russian trade is inevitable as a consequence of aggression in Ukraine.
Looking at monthly data, exports in the top 10 economies were increasing through most of 2021, as well as in January and February 2022, but the situation started changing in March 2022, when export growth dynamics slowed down in seven of 10 economies, while the UK noted a significant drop in exports value.
The latest data for June 2022 points to positive growth in almost all the states apart from EU (external trade) and Japan, which noted a 6.1% and 2.0% decrease respectively, in the value of exports. On the other hand, the highest year-on-year growth rates are seen in India (30.4%), the U.S. (23.6%), and Canada (22.7%).
Imports, in turn, followed a similar trend as exports in 2021 and the beginning of 2022, followed by a slowing dynamic of growth in March 2022 in five out of the top 10 countries. The most significant slowdown in March 2022 was noted for mainland China with year-on-year growth in the value of imports reaching only 0.6%.
The most recent data for mainland China show a positive trend in year-on-year growth for exports and imports, marking a 17.7% and 17.8% increase in exports value in June and July 2022, respectively, and limited, but still positive growth in imports by 1.5% and 2.5% in June and July 2022.
Coming back to the most recent results in the value of imports, the highest growth in June 2022 was noted by India, with imports increasing by 57.6%. The country was followed by Brazil, marking 33.9% growth, and EU (External trade), with a 23.3% increase.
Three economies had already published data for July 2022—Brazil, mainland China, and South Korea, with the highest growth for exports reported by, the already mentioned, mainland China (17.8% y/y) and Brazil (17.4 % y/y). In terms of imports, Brazil also marks a very high increase in July 2022 (35.2% y/y), followed by South Korea, with 21.8% growth year-on-year.
Prospects for the Forthcoming Months
Inflation and global macroeconomic environment
Over the last months, the main macroeconomic drivers impacting global trade are hiking inflation in the world, closely connected to the global economic slowdown, both induced by several geopolitical events, such as the COVID-19 pandemics, the war in Ukraine, or global value chains disruptions. The inflation is fueled primarily by the energy and food sectors. For another month in a row, the forecasts of inflation by the Economic and Country Risk team show an upward revision of inflation in the short-term.
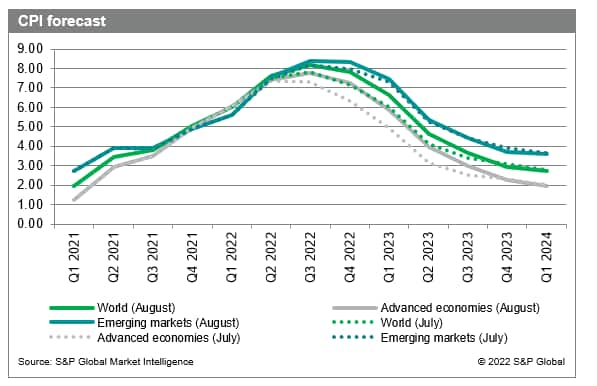
According to the newest data on inflation as of August 2022, inflation in the world will reach its peak in Q3 at 8.16% level, compared to 7.61% in the second quarter, and 6.01 in the first quarter of 2022. The decay of inflationary pressure is expected to start in the second quarter of 2023 (6.64%) and return to the long-term trend from the last quarter of 2023 (2.94%).
At the same time, the inflation in emerging markets exceeded advanced economies in the second quarter of 2022 (7.54% and 7.40%, respectively) after the switch-off lasted two quarters. Due to the lag in inflation dynamics of emerging economies, the peak of inflation is expected there a quarter later than in advanced economies, which is the third quarter of 2022 (8.38%).
Compared to the previous month's forecasts (July 2022), inflation in the world is revised to be significantly higher in all quarters - 0.1 p.p. in the second quarter, 0.3 p.p. in the third quarter, and 0.7 p.p. in the last quarter of 2022, and 0.6 in the first quarter of 2023, after already strong upward revision last month. Similarly, in advanced economies, the revision equaled 0.1 p.p. in the second quarter, 0.5 p.p. in the third quarter, and 0.9 p.p. in the fourth quarter of 2022, and the first quarter of 2023. In the case of emerging markets, the expectations increased in the next four quarters by 0.1 p.p., 0.2 p.p., 0.3 p.p., and 0.2 p.p., respectively in the second, third, and fourth quarters of 2022 and the first quarter of 2023.

War in Ukraine
From a strategic perspective, the situation in Ukraine did not change significantly over the last month. As we noted in the previous edition of Global Trade Monitoring in July, the impact of the war in Ukraine on world trade comes primarily through commodity prices and is expected to decrease global trade in 2022 by approximately 1 p.p.
Also, in August Ukraine started to export grains, primarily to North Africa, the Middle East, and Asian countries, reducing the threat of a large-scale food crisis to some extent. At the same time, we estimate that the Ukrainian economy is about to export around half of its previous capacity.
From the Russian perspective, trade shifts from developed countries that imposed sanctions, to other destinations have been already visible in the GTAS data. The main destinations are primarily mainland China and India, but also a few other countries in the region.
Geopolitical tensions in East Asia
Following U.S. House Speaker Nancy Pel's visit to Taiwan and mainland China's military exercises in the beginning of August, the geopolitical situation in the Taiwan strait remains tense. The situation needs to be carefully monitored, as any form of escalation may possibly result in trade sanctions, thus significantly impacting global trade.
On the other hand, in line with GTAS data, almost three fourth of total Taiwan exports is related to electronics and computers. From the global perspective, according to GTAS Forecasting data, Taiwan is the second largest (after mainland China) exporter of electronic valves, tubes, semiconductors, and electronic components in the world, responsible for 17% of total exports in 2021. In the case of escalation of the conflict, export disruptions may significantly worsen the global semiconductor shortage, spilling over to different industries (e.g. computer or automotive).
Next wave of COVID-19 pandemics
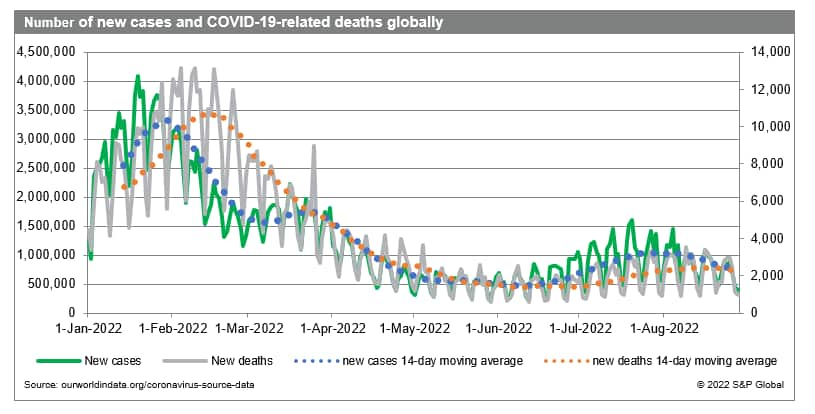
After another significant increase in COVID-19 new cases in the World in July, approaching 1.5 million new cases daily in the World, in August the pandemic situation seems to stabilize, with daily new cases dropping below 1 million.
At the same time, the pandemic situation in mainland China needs to be carefully monitored, as several large cities reintroduced some of the restrictions as a reaction to the new wave of infections, sustaining their zero-COVID policy. This reminds the situation from the first half of 2022 when strict lockdowns resulted in temporal strong economic activity reduction. At this point, however, complete lockdowns are not introduced, it should be noted that the pandemic situation is extremely hard to predict.

Leading Economies of the World and Methodological Issues
The top 10 economies by GDP in 2021 include the U.S., EU27, China (Mainland), Japan, the UK, India, Brazil, South Korea, Canada, and Russia.
The top 10 group member states are responsible for approximately four-fifths of the world GDP and three-quarters of global exports, with most trade carried out within the group.
In the monthly Global Trade Monitoring commentary, we present year-on-year changes in the value of exports and imports for available monthly trade data from S&P Global Market Intelligence - Global Trade Atlas (GTA) in percentage.
Data edge differs from state to state depending on a given reporter and its reporting calendar.
For the EU Member States, we consider only EU external trade with non-EU states.
Please note that historical data in the GTA database are being adjusted monthly due to revisions introduced by the reporting states, potentially causing adjustments to the growth rates reported in the commentary provided by the Global Trade Monitoring from prior months (the report reflects the most recent data available).
Posted 15 September 2022 by Agnieszka Maciejewska, Associate Director, Models & Scenarios, Global Intelligence & Analytics and
Katarzyna Skrzypek, Senior Economic Research Consultant, Global Trade Forecasting, Maritime, Trade & Supply Chain, S&P Global Market Intelligence
This article was published by S&P Global Market Intelligence and not by S&P Global Ratings, which is a separately managed division of S&P Global.
How can our products help you?
