Customer Logins

Obtain the data you need to make the most informed decisions by accessing our extensive portfolio of information, analytics, and expertise. Sign in to the product or service center of your choice.

Customer Logins

My Logins

All Customer Logins
S&P Global S&P Global Marketplace
Explore S&P Global

  • S&P Global
  • S&P Dow Jones Indices
  • S&P Global Market Intelligence
  • S&P Global Mobility
  • S&P Global Commodity Insights
  • S&P Global Ratings
  • S&P Global Sustainable1
Close
Discover more about S&P Global's offerings
Investor Relations
  • Investor Relations Home
  • Presentations
  • Investor Fact Book
  • News Releases
  • Quarterly Earnings
  • SEC Filings & Reports
  • Executive Committee
  • Governance
  • Merger Information
  • Stock & Dividends
  • Shareholder Services
  • Contact
Support
  • Contact Us
  • Media Contacts
S&P Global ESG Sustainable1
  • Who We Are
  • Who We Serve
  • Solutions
  • Research & Insights
  • Events
  • Speak to a Specialist
  • Speak to a Specialist
  • Speak to a Specialist
  • Who We Are
      About Purpose Approach People History
  • Who We Serve
      Academia Commercial Banking Corporations Exchanges and Issuers Insurance Investment Banking Investment Management Private Equity Client Case Studies
  • Solutions
      Our SolutionsSustainability Reporting ESG Scores and Raw Data Physical Climate Risk Nature Positive Net Zero Carbon Markets  Energy Transition Second Party Opinions Climate Transition Assessment Sustainability Indices Corporate Sustainability Assessment Sustainability Benchmarking Services ExploreClimate Center of Excellence Transition Tracker Quality Imperative Data Coverage Methodologies Industry Materiality
  • Research & Insights
      Our Latest Blogs Research Reports All Things Sustainable Podcast Sustainability Quarterly Research Journal Sustainability Matters Video Series Climate Risk & Resilience Sustainability Regulation and Standards Sustainable Finance The Path to Net Zero
  • Events
      All Events Webinar Replays
Investor Relations
  • Investor Relations Home
  • Presentations
  • Investor Fact Book
  • News Releases
  • Quarterly Earnings
  • SEC Filings & Reports
  • Executive Committee
  • Governance
  • Merger Information
  • Stock & Dividends
  • Shareholder Services
  • Contact
Support
  • Contact Us
  • Media Contacts
    • About
    • Purpose
    • Approach
    • People
    • History
    • Academia
    • Commercial Banking
    • Corporations
    • Exchanges and Issuers
    • Insurance
    • Investment Banking
    • Investment Management
    • Private Equity
    Client Case Studies
  • Our Solutions
    • Sustainability Reporting
    • ESG Scores and Raw Data
    • Physical Climate Risk
    • Nature Positive
    • Net Zero
    • Carbon Markets
     
    • Energy Transition
    • Second Party Opinions
    • Climate Transition Assessment
    • Sustainability Indices
    • Corporate Sustainability Assessment
    • Sustainability Benchmarking Services
    Explore
    • Climate Center of Excellence
    • Transition Tracker
    • Quality Imperative
    • Data Coverage
    • Methodologies
    • Industry Materiality
    • Our Latest
    • Blogs
    • Research Reports
    • All Things Sustainable Podcast
    • Sustainability Quarterly Research Journal
    • Sustainability Matters Video Series
    • Climate Risk & Resilience
    • Sustainability Regulation and Standards
    • Sustainable Finance
    • The Path to Net Zero
    • All Events
    • Webinar Replays

Indian Power Market Analysis

Power generation skewed toward coal but renewables on the rise

India has the fifth largest power generation capacity in the world with installed capacity of 344 GW (as of financial year FY 2018). The country ranks third globally while second in the Asia-Pacific region in terms of electricity production (equivalent to approximately 1,201 Billion Units (BU) during FY18). Owing to fast-paced economic growth, urbanization, and gains in electrification access, India’s electricity demand has been growing at a rate of 5.5% on an average over the last decade. Despite being the country with the fastest growing electricity demand, nearly one-fourth of Indian households has no access to electricity and the per-capita consumption (~1100 units) remains the lowest worldwide.

Keep pace with India’s power market
LEARN MORE

Electricity is a concurrent subject and both federal and state governments have jurisdiction in India’s power market structure. Electricity Act 2003 (EA) marked the transformation of the sector, providing consolidation of laws, promotion of competition, private participation and delicensing of generation. EA also emphasized tariff-related policy formulation and setting up of regulatory commissions. Policy developments and establishment of power markets provided needed stimulus for capacity additions, which witnessed steep growth over the last decade. Annual average power generation capacity grew at 9% during FY 2008 to FY 2018 vis-à-vis a demand growth of 5.6% during the same period. This resulted in a decline in power shortages from highs of 11% during FY 2008 to current deficits of less than 1%.

The power generation mix is heavily skewed toward coal with 76% contribution, because of cheaper domestic fuel availability. Its share in the mix has increased over the years due to constraints in adding other conventional generation sources—hydro, nuclear and gas. Renewable energy sources, on the other hand, supported by state policies and declining costs, however, have seen strong gains, contributing 8% to the generation mix. The capacity additions during the last financial year came largely from renewable energy sources (approximately 12 GW), including 9.3 GW additions from solar power. Conversely, coal capacity additions were subdued during the same period as the narrowing demand-supply gap resulted in surplus power generating capacity impacting the average utilization rates of the coal plants. Natural gas, which makes up 8% of capacity, contributes to only 4% in the generation mix owing to the gas feedstock constraints. PLFs for gas-fired plants have also dropped to critically low levels, and close to 14 GW capacity stands stranded.


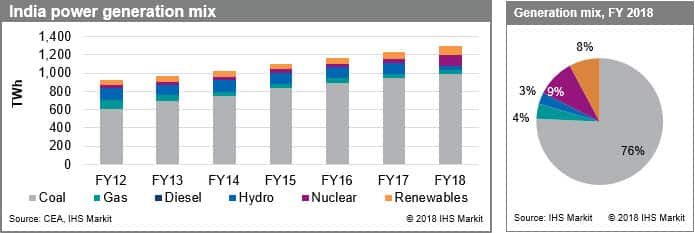
India’s power generation mix, FY12-FY18

Renewable energy is gaining momentum and has grown at an annual growth of 20% over the last five years vis-à-vis coal, which grew at 9%. Wind energy has the largest share and accounts for approximately 50% of total installed capacity (69.02 GW). In 2015, India announced one of the most ambitious renewable targets globally to reach 175GW by 2022, including 100GW solar, 60GW wind and the rest from biomass and small hydro. Capacity growth is driven by strong policy support, demand creation through targets and regular tenders and falling cost of renewables. The majority of wind and solar capacity is concentrated in southern and western part of India, as these states have high renewable resources coupled with a supportive policy environment. Going forward, the growth of renewables in India will depend on the country’s ability to address administrative, institutional, and infrastructure challenges timely through reliable contracts, distribution sector reforms, and grid strengthening.


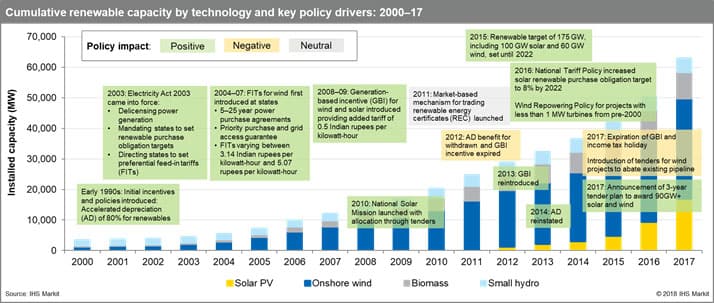
India’s renewable installed capacity, 2000-17

The transmission sector has recorded noticeable growth over the past three years, increasing from 530,546 MVA in FY 2014 to 826,958 MVA in FY 2018. This has resulted in lower grid congestion and improved market activity. Retail sector on the other hand, is suffering from high debt levels of distribution companies (DISCOMs), raising concerns over the creditworthiness of the DISCOMs. However, with the implementation of the Ujwal Discom Assurance Yojana (UDAY) scheme, states have taken over the debt (worth approximately 2.321 trillion Indian rupees) owned by their respective DISCOMs. The states allied with UDAY have also observed an improvement in aggregated technical and commercial (AT&C) losses, which dropped to about 19% in FY 2018.

All the states and union territories of India are on board to fulfil the Government of India's vision of ensuring 24x7 affordable and quality power for all by March 2019. To achieve this target, the state has enacted policies to improve fuel availability and energy efficiency, support renewable capacity additions, and enhance grid infrastructure.

Related products

Greater China PGCR

South and Southeast Asia PGCR

North America PGCR

Russia and Caspian PGRC

European PGCR

LNG

Global Gas

Explore

RELATED INDUSTRIES & TOPICS
  • Natural Gas / LNG Markets
{"items" : [ {"name":"facts","url":"","enabled":false,"desc":"","alt":"","mobdesc":"PDF","mobmsg":""},{"name":"login","url":"","enabled":false,"desc":"Product Login for existing customers","alt":"Login","large":true,"mobdesc":"Login","mobmsg":"Product Login for existing customers"},{"name":"sales","override":"","number":"[num]","enabled":true,"desc":"Call Sales [num]","proddesc":"[num]","alt":"Call Sales</br>[num]","mobdesc":"Sales","mobmsg":"Call Sales: [num]"}, {"name":"share","enabled":true,"desc":"<strong>Share</strong>","mobdesc":"Share","options":[ {"name":"facebook","url":"https://www.facebook.com/sharer.php?u=http%3a%2f%2fwww.spglobal.com%2fesg%2fs1%2ftopic%2findian-power-market-analysis.html","enabled":true},{"name":"twitter","url":"https://twitter.com/intent/tweet?url=http%3a%2f%2fwww.spglobal.com%2fesg%2fs1%2ftopic%2findian-power-market-analysis.html&text=Indian+Power+Market+-++Current+Scenario+%26+Future+Growth+%7c+S%26P+Global","enabled":true},{"name":"linkedin","url":"https://www.linkedin.com/sharing/share-offsite/?url=http%3a%2f%2fwww.spglobal.com%2fesg%2fs1%2ftopic%2findian-power-market-analysis.html","enabled":true},{"name":"email","url":"?subject=Indian Power Market - Current Scenario & Future Growth | S&P Global&body=http%3a%2f%2fwww.spglobal.com%2fesg%2fs1%2ftopic%2findian-power-market-analysis.html","enabled":true},{"name":"whatsapp","url":"https://api.whatsapp.com/send?text=Indian+Power+Market+-++Current+Scenario+%26+Future+Growth+%7c+S%26P+Global http%3a%2f%2fwww.spglobal.com%2fesg%2fs1%2ftopic%2findian-power-market-analysis.html","enabled":true}]}, {"name":"rtt","enabled":true,"mobdesc":"Top"} ]}
Filter Sort
  • Our Values
  • Investor Relations
  • Contact Customer Care & Sales
  • Careers
  • Our History
  • News Releases
  • Support by Division
  • Corporate Responsibility
  • Ventures
  • Quarterly Earnings
  • Report an Ethics Concern
  • Leadership
  • Press
  • SEC Filings & Reports
  • Office Locations
  • IOSCO ESG Rating & Data Product Statements
  • © 2025 S&P Global
  • Terms of Use
  • Cookie Notice
  • Privacy Policy
  • Do Not Sell My Personal Information
  • 中文