- Speak to a Specialist
- Who We Are
- Who We Serve
- Solutions
- Research & Insights
- Events
Contributors: Neil McIndoe | Sidiq Dawuda | Lynn Bachstetter
Published: Aug 13, 2021
The Bank of England’s Climate Biennial Exploratory Scenario (CBES) assesses the resilience of banks and insurers to climate‑related risks associated with the move to a net zero economy under three scenarios: early action by governments to cut carbon emissions, late action and no additional action.
Two main risks are considered: physical risks from the impact of fires, floods and more caused by climate change, and transition risks from the move to more climate-friendly businesses that could bring sudden changes in asset values and the price of carbon.
Data granularity is of utmost importance. To produce an accurate analysis at the individual company level, granular information is needed on a firm’s fixed assets and emissions across geographies. This is especially important for large companies that operate in multiple countries.
The Bank of England has kicked off its 2021 CBES to assess the resilience of the largest UK banks and insurers to climate-related risks associated with the move to a net zero economy. The Bank intends for the CBES to be a learning exercise, helping stakeholders better understand any adjustments that might be needed in coming decades for the financial system to remain resilient.
It is the first climate stress test in which participants will perform asset-level counterparty modeling. For banks, the CBES focuses on the credit risk associated with the banking book, with an emphasis on a detailed analysis of risks to large corporate counterparties.
The stress tests are based on three customized scenarios that draw upon a subset of those developed by the Network for Greening the Financial System (NGFS).1 The scenarios are not forecasts of the most likely future outcomes, but plausible representations of what might happen based on different future paths of governments’ climate policies (i.e., policies aimed at limiting the rise in global temperature).
The scenarios include early action by governments globally to cut carbon emissions, late action and no additional action. They are assumed to take place over the period from 2021 to 2050 and will be applied to two main risks:


Initial submissions from participants are due by the end of September 2021, and the intent is to have aggregate, rather than firm-by-firm, results published in May 2022. This could happen earlier if an additional round of submissions is not needed.

Additional information for banks has been provided in a number of areas.2
The aim is to size risks and responses to climate change via the three scenarios and incorporate both physical and transition risks to 2050. Incorporating these two elements is critical for two reasons.
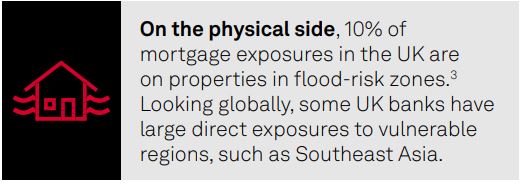
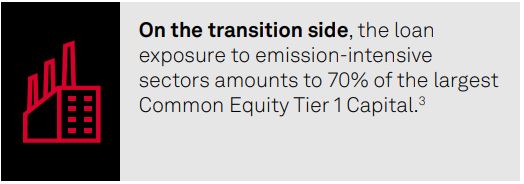
For banks, a key metric of risk will be the cumulative total of provisions at various points in the scenarios. Traded risk and non-traded market risk will be out of scope. Banks are also asked to submit projections for risk-weighted assets in the scenario, but at a far less granular level than projections for provisions.
Banks are asked to only report projections for years 10 and 30 in the counterparty projection templates in the “no additional action” scenario.
Banks are to adopt a fixed balance sheet assumption for the bulk of the quantitative projections, with the resilience of year‑end 2020 balance sheets to climate-related financial risks being tested at different points in each scenario.
Consistent with this, market value fluctuations at banks will have no impact on the exposure. In addition, fair value effects will have no impact on the exposure. Relatedly, baseline trend growth in variables such as property prices or corporate profits should not be modeled as reducing loan‑to‑value ratios or corporate income coverage ratios, for example.
This should include at least 100 of the largest and most material corporate counterparties, where those exposures are greater than £10 million. Participants are strongly encouraged to extend the detailed analysis to more corporate counterparties than these top 100.
Banks are to report the cumulative stock of provisions at the end of each reporting period. When exposures move to IFRS 9 stage three, these credit-impaired exposures should remain locked there for the remainder of the scenario. In addition, cures from stage three back to non-credit-impaired should not be assumed. However, this assumption should not influence provision calculations, where implicit cures can still be assumed in Loss Given Default estimates.
Banks should assume that the residual maturity of their assets remains constant. Similarly, the outstanding balance of a loan should not be reduced due to amortization.
Data granularity is of utmost importance. To produce an accurate analysis at the individual company level, granular information is needed on a firm’s fixed assets and emissions across geographies. This is especially important for large companies that often operate in multiple countries.
On the physical risk side, there have been more frequent and severe damages from weather-related conditions. In addition, multiple physical risks may affect the same location, yet to a different extent. This requires detailed geolocation data at the asset level. On the transition risk side, the speed of change will depend on what tools governments adopt to facilitate the process. One of the main policy tools is the introduction or increase of a carbon tax, and the impact will depend on the position taken by the country in question. Given this, it may not be enough to apply a flat increase or a global carbon tax across all countries and industries.
Another challenge is related to the long time horizon in question for CBES relative to conventional stress testing. For physical risks, for example, the Bank is proposing that they occur by 2050.
Figure 1: Physical Risk Heatmap
It is also important to consider the different ways companies may respond. Some may proceed by adopting new, greener technology, while others may keep operating under a business‑as‑usual stance. In the most extreme cases, governments may limit or ban the use of certain materials, leading to a reduction in company revenues due to asset stranding until alternative approaches are adopted. New technologies may also be devised within the next 30 years, affecting overall carbon emissions. Here, the Bank will define emission pathways, at least at a regional and industry sector level, and also determine the renewable energy deployment and carbon capture and storage mechanisms that will be available.
Of course, there will be opportunities in addition to risks. Companies that adapt will incur abatement costs but, on the flip side, will potentially increase their competitiveness and gain market share versus their competitors.
S&P Global assesses risks relating to climate change, natural resource constraints and broader environmental, social and governance factors, and offers a wide range of capabilities to assist banks with their CBES exercises.
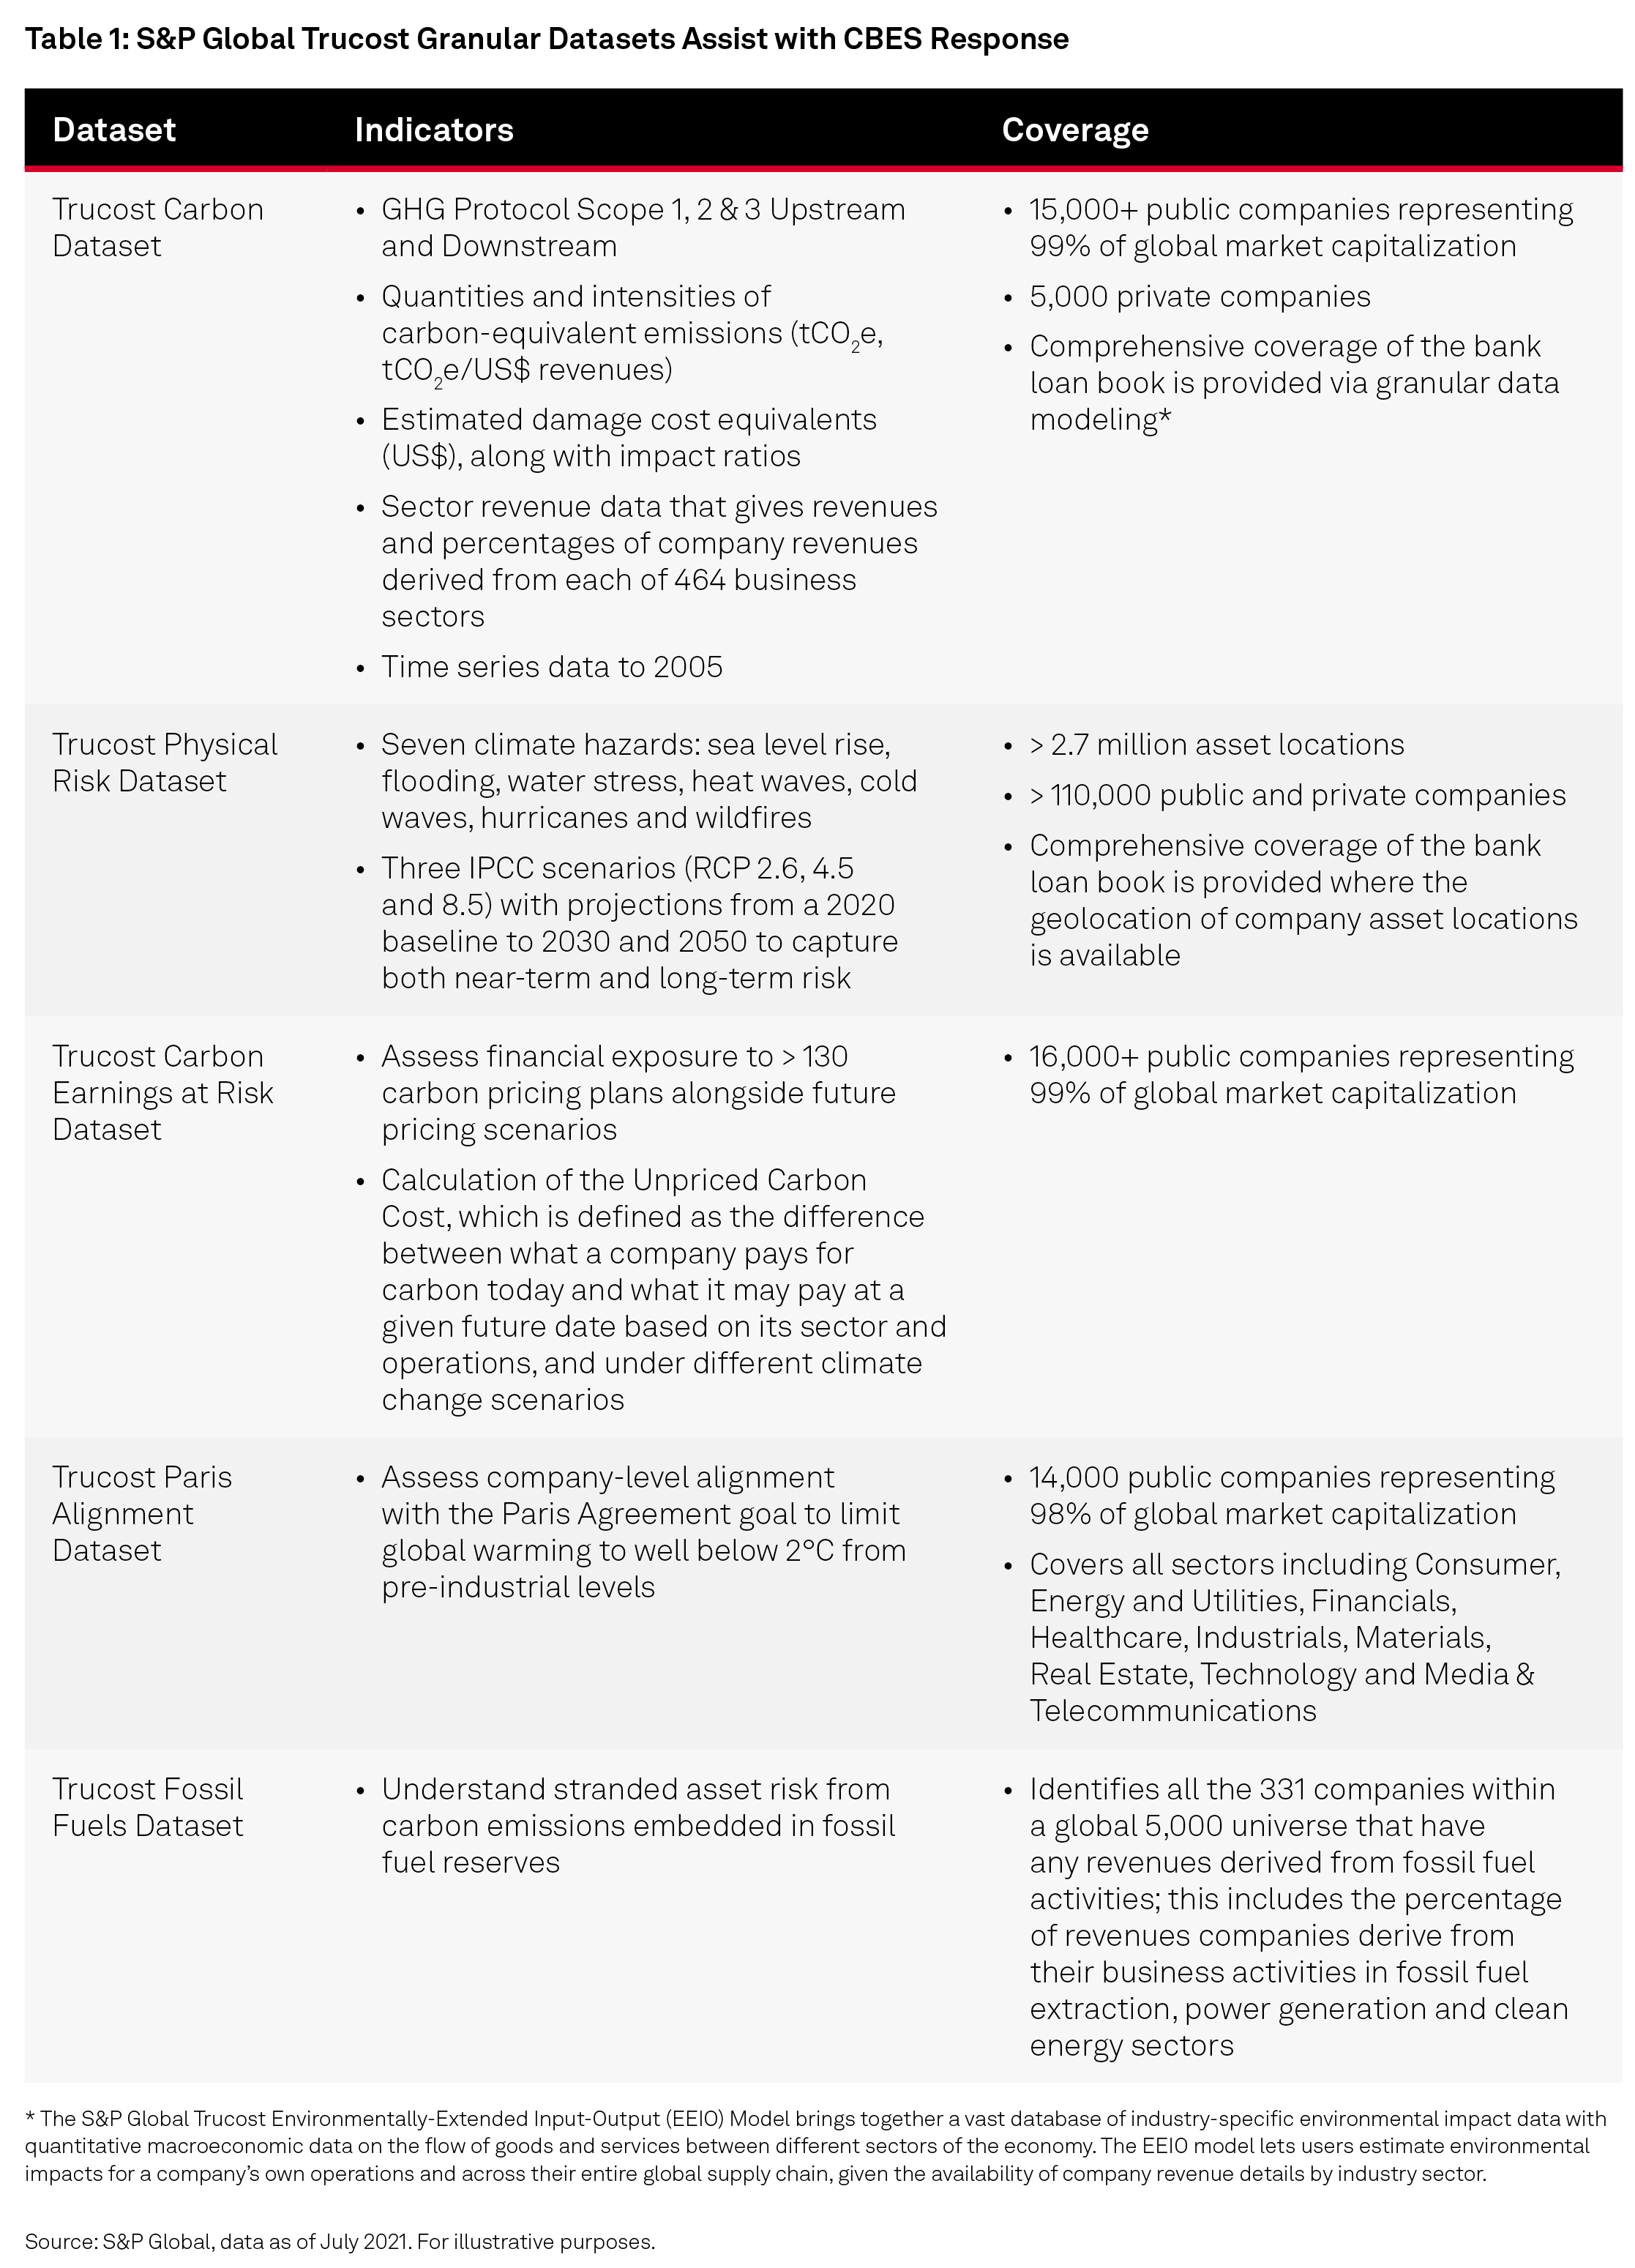
For banks that have been developing their own models, this includes extensive environmental data on over 16,000 companies,4 covering Scope 1, 2, and 3. It also includes data to assess the potential impact on a company’s earnings today if they have to pay a future price for their greenhouse gas (GHG) emissions through a carbon tax. In addition, it includes detailed information on the exposure of company-owned facilities and capital assets to seven climate‑related physical impacts under different climate change scenarios. These capabilities are described in more detail below.
Since the CBES initiative is very new, many banks prefer to access a ready-built solution, or use this type of solution to benchmark their own activities. Climate Credit Analytics (CCA), a climate stress‑testing framework and scenario analysis model suite, enables counterparty- and portfolio-level reviews of climate‑related financial and credit risks for thousands of public and private companies across multiple sectors globally. These tools combine S&P Global Market Intelligence’s data resources and credit analytics capabilities with Oliver Wyman’s5 climate scenario and stress-testing expertise.
Especially important, CCA enables banks to assess the impact of a transition to a low-carbon economy on the creditworthiness of their counterparties. The model covers five carbon-intensive sectors (Airlines, Automotive, Metal & Mining, Oil & Gas and Power Generation), and also provides a generic approach that covers all other sectors. These scenarios are built on those produced by the NGFS, which the Bank has adjusted slightly for the purpose of its own exercise. CCA is extremely flexible, enabling users to customize scenarios and override other input factors to meet their particular needs.
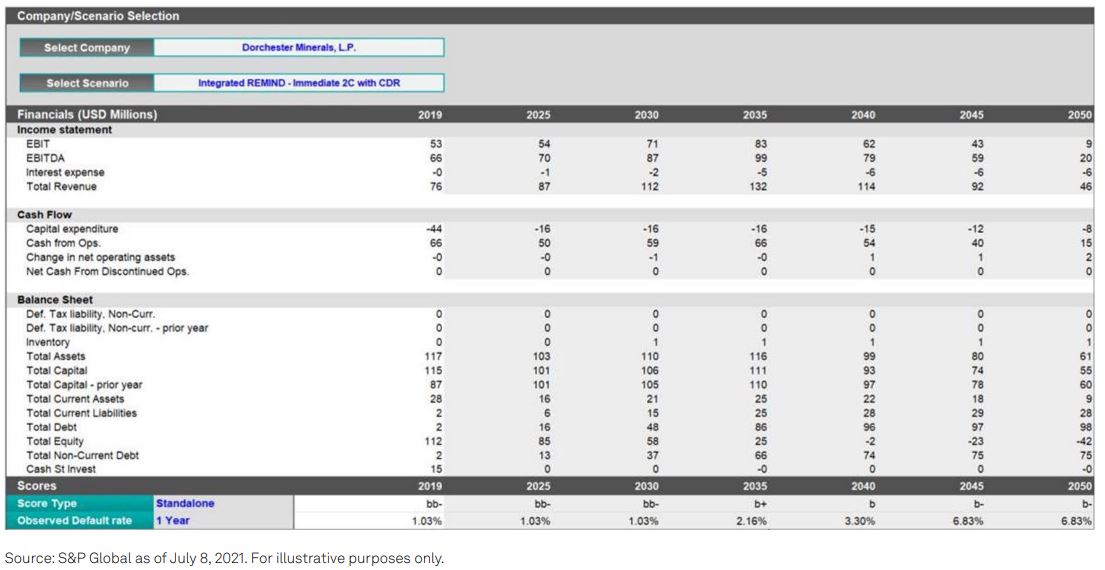
The figures below show sample output from CCA for an Oil & Gas company. Figure 2 shows starting the stress test analysis by selecting the companies, NGFS or carbon scenarios and the time interval for the results, with a maximum to year 2050.
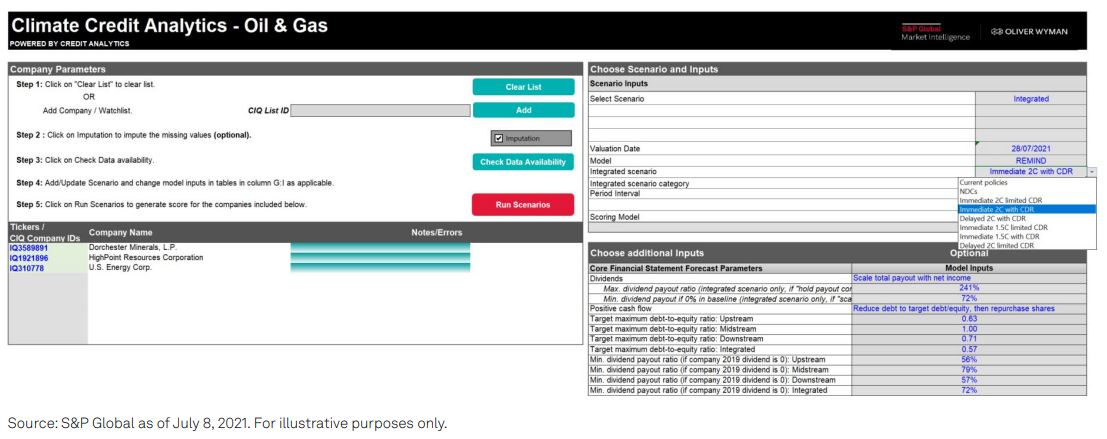
In Figure 3A, the financial results show a snapshot of the actual balance sheet, income statement and cash flow statement, and then forecasts of new financials based on the scenario and time horizon selected.
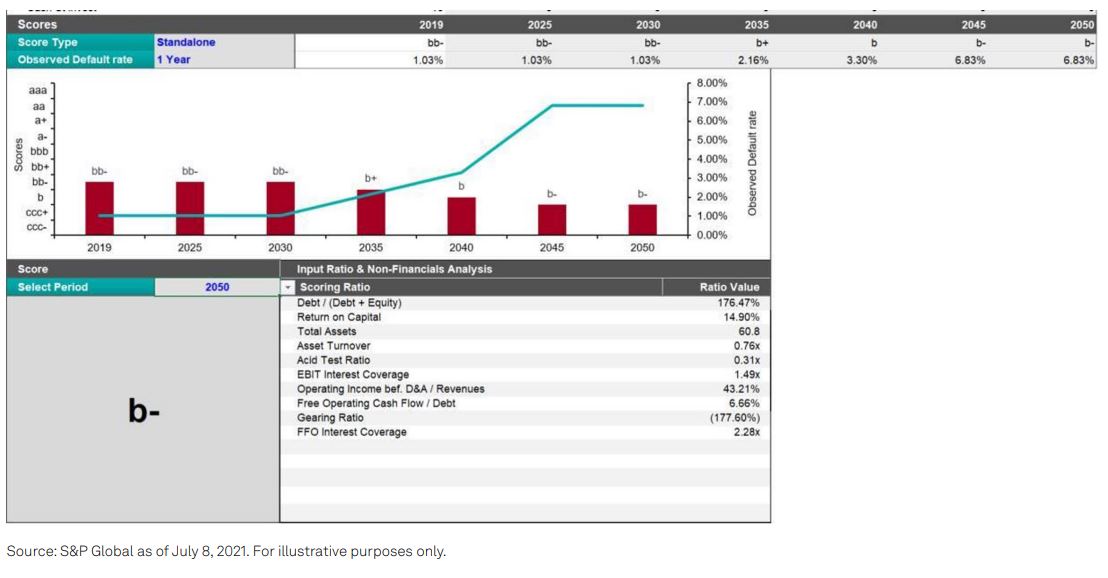
In Figure 3B, the score results show the credit score changes based on the choice of scenario and time horizon.
Of course, frameworks for addressing the requirements of CBES will be very relevant as other central banks begin to introduce stress testing.
![]()
Trucost Carbon Emissions Data contains information on over 16,000 companies,6 covering Scope 1, 2 and 3 with metrics on quantities and intensities of carbon‑equivalent emissions (tCO2 e, tCO2 e/US$ revenues) and their estimated damage cost equivalents (US$), along with impact ratios. It contains sector revenue data that gives revenues and percentages of company revenues derived from each of 464 business sectors. Data goes back to 2005, where available.
![]()
Trucost Environmentally-Extended Input-Output (EEIO) Model brings together a vast database of industry-specific environmental impact data with quantitative macroeconomic data on the flow of goods and services between different sectors of the economy. The EEIO model lets users estimate environmental impacts for a company’s own operations and across their entire global supply chain, given the availability of company revenue details by industry sector
![]()
Trucost Carbon Earnings at Risk Dataset can be used to stress test a company’s current ability to absorb future carbon prices and understand potential earnings at risk from carbon pricing at a portfolio level. Integral to this analysis is the calculation of the Unpriced Carbon Cost, which is defined as the difference between what a company pays for carbon today and what it may pay at a given future date based on its sector, operations and a given policy price scenario.
![]()
Trucost Climate Change Physical Risk Analytics offers an asset-level approach to the assessment of physical risk at the company and portfolio level. This includes data that provides detailed information to help understand the exposure of company-owned facilities and capital assets to seven climate-related physical impacts (i.e., flood, water stress, heat wave, cold wave, hurricanes, sea level rise and wildfire) under different climate change scenarios. Scores at an asset level can then be aggregated to a company.
![]()
Trucost Paris Alignment Dataset assesses company‑level alignment with the Paris Agreement goal to limit global warming to well below 2°C from pre‑industrial levels. This dataset enables investors to track their portfolios and benchmarks against the goal of limiting global warming to 1.5°C and 2°C climate change scenarios.
![]()
Trucost Fossil Fuels Dataset identifies all the 331 companies within a global 5,000 universe that have any revenues derived from fossil fuel activities. This includes the percentage of revenues companies derive from their business activities in fossil fuel extraction, power generation and clean energy sectors.
![]()
The Energy offering delivers a range of capabilities from company financials and commodity pricing to detailed statistics, summaries and project tracking. Data covers industry subsectors, such as Power, Natural Gas, Renewables and Coal. News provides essential sector-specific regulatory and financial updates. Key types of data available include market details, corporate finance data, supply and demand analytics, power plant data, third-party commodity prices, power forecasts and more
![]()
XpressfeedTM automates the download and management of S&P Global data and enables delivery as needed in a ready‑to‑query relational database to link to internal applications.
![]()
Cross Reference Services enables the linking of over 63 million instruments to a range of identifiers (such as ISINs and CUSIPs), 28 million entities to the S&P Capital IQ Company ID, and industry sectors to GICS and other industry classifications schemes.7
1 NGFS is a group of 66 central banks and supervisors and 13 observers committed to sharing best practices on transitioning to a sustainable economy. The NGFS climate scenarios were produced in partnership with an academic consortium from the Potsdam Institute for Climate Impact Research (PIK), International Institute for Applied Systems Analysis (IIASA), University of Maryland (UMD), Climate Analytics (CA) and the Swiss Federal Institute of Technology in Zurich (ETHZ).
2 Comments are based on: “Guidance for participants of the 2021 Biennial Exploratory Scenario: Financial risks from climate change,” Bank of England, June 2021.
3 “Discussion Paper — The 2021 biennial exploratory scenario on the financial risks from climate change,” Bank of England, December 2019.
4 All data as of January 2021.
5 Oliver Wyman is an independent company and is not related to S&P Global or any of its divisions
6 All data coverage numbers as of February 2021.
7 ISIN=International Securities Identification Number; GICS=Global Industry Classification Standard. Data as of September 2020