- Speak to a Specialist
- Who We Are
- Who We Serve
- Solutions
- Research & Insights
- Events
An examination of the U.K. and Norwegian North Sea, using a new and comprehensive approach to upstream oil and gas production emissions, finds that the average greenhouse gas intensity of production in 2021 was 12 kilograms of carbon dioxide equivalent per barrel of oil equivalent. Productivity, electrification and the extent of gas flaring all contribute to different levels of emissions for production operated by the U.K. and by Norway.
Published: October 27, 2022
S&P Global Commodity Insights has developed an entirely new and comprehensive approach to estimating upstream oil and gas production emissions. Internationally (outside North America, which uses a different approach), we are now capable of estimating the totality of an upstream oil and gas play’s emissions and emissions intensity —from across the play, down to individual assets and the sources of emissions, such as the fuels, that underpin each operation.
An examination of the U.K. and Norwegian North Sea found that the average greenhouse gas intensity of production in 2021 was 12 kilograms of carbon dioxide equivalent per barrel of oil equivalent (kgCO2e/boe); however, considerable variation exists. The study included 265 individual oil and gas fields and projects, consolidated into 84 key hubs or stand-alone projects. The greenhouse gas intensity across the study area ranged from less than 1 kgCO2e/boe to nearly 150 kgCO2e/boe. Nearly two-thirds of production was found to be beneath the basinwide average. Almost 80% of production occurring from only 20 assets accounted for just 50% of total emissions.
Productivity, electrification and flaring are key sources of emissions differentiation in the North Sea. U.K. production was estimated to be, on average, about 2.5 times more greenhouse gas intensive than Norway. Younger, or less mature and more productive, assets principally located in the Norwegian offshore were, on average, lower intensity compared with the U.K. The greenhouse gas intensity of Norwegian operations benefited from electrification projects, which tied back to Norway’s hydro-dominated power grid, as well as stricter controls on venting and flaring. On average, venting and flaring accounted for about 9% of total emissions from Norwegian operations compared with 28% in the U.K.
Authors: Chris Kennett, Associate Director, S&P Global Commodity Insights | Kevin Birn, Vice President, S&P Global Commodity Insights | Hugh Ewan, Senior Technical Research Analyst, S&P Global Commodity Insights
The North Sea is one of the most significant oil- and gas–producing regions globally. Although its contribution has declined over the past 20 years, it still accounted for nearly 4% of global oil supply in 2021. Since the initial fields were discovered in the 1960s, a complex network of offshore platforms, drilling operations, subsea recovery units, and pipelines has evolved. Most production comes from offshore facilities located in Norway and the U.K., with lower levels of activity in the Danish, Dutch and German offshore.
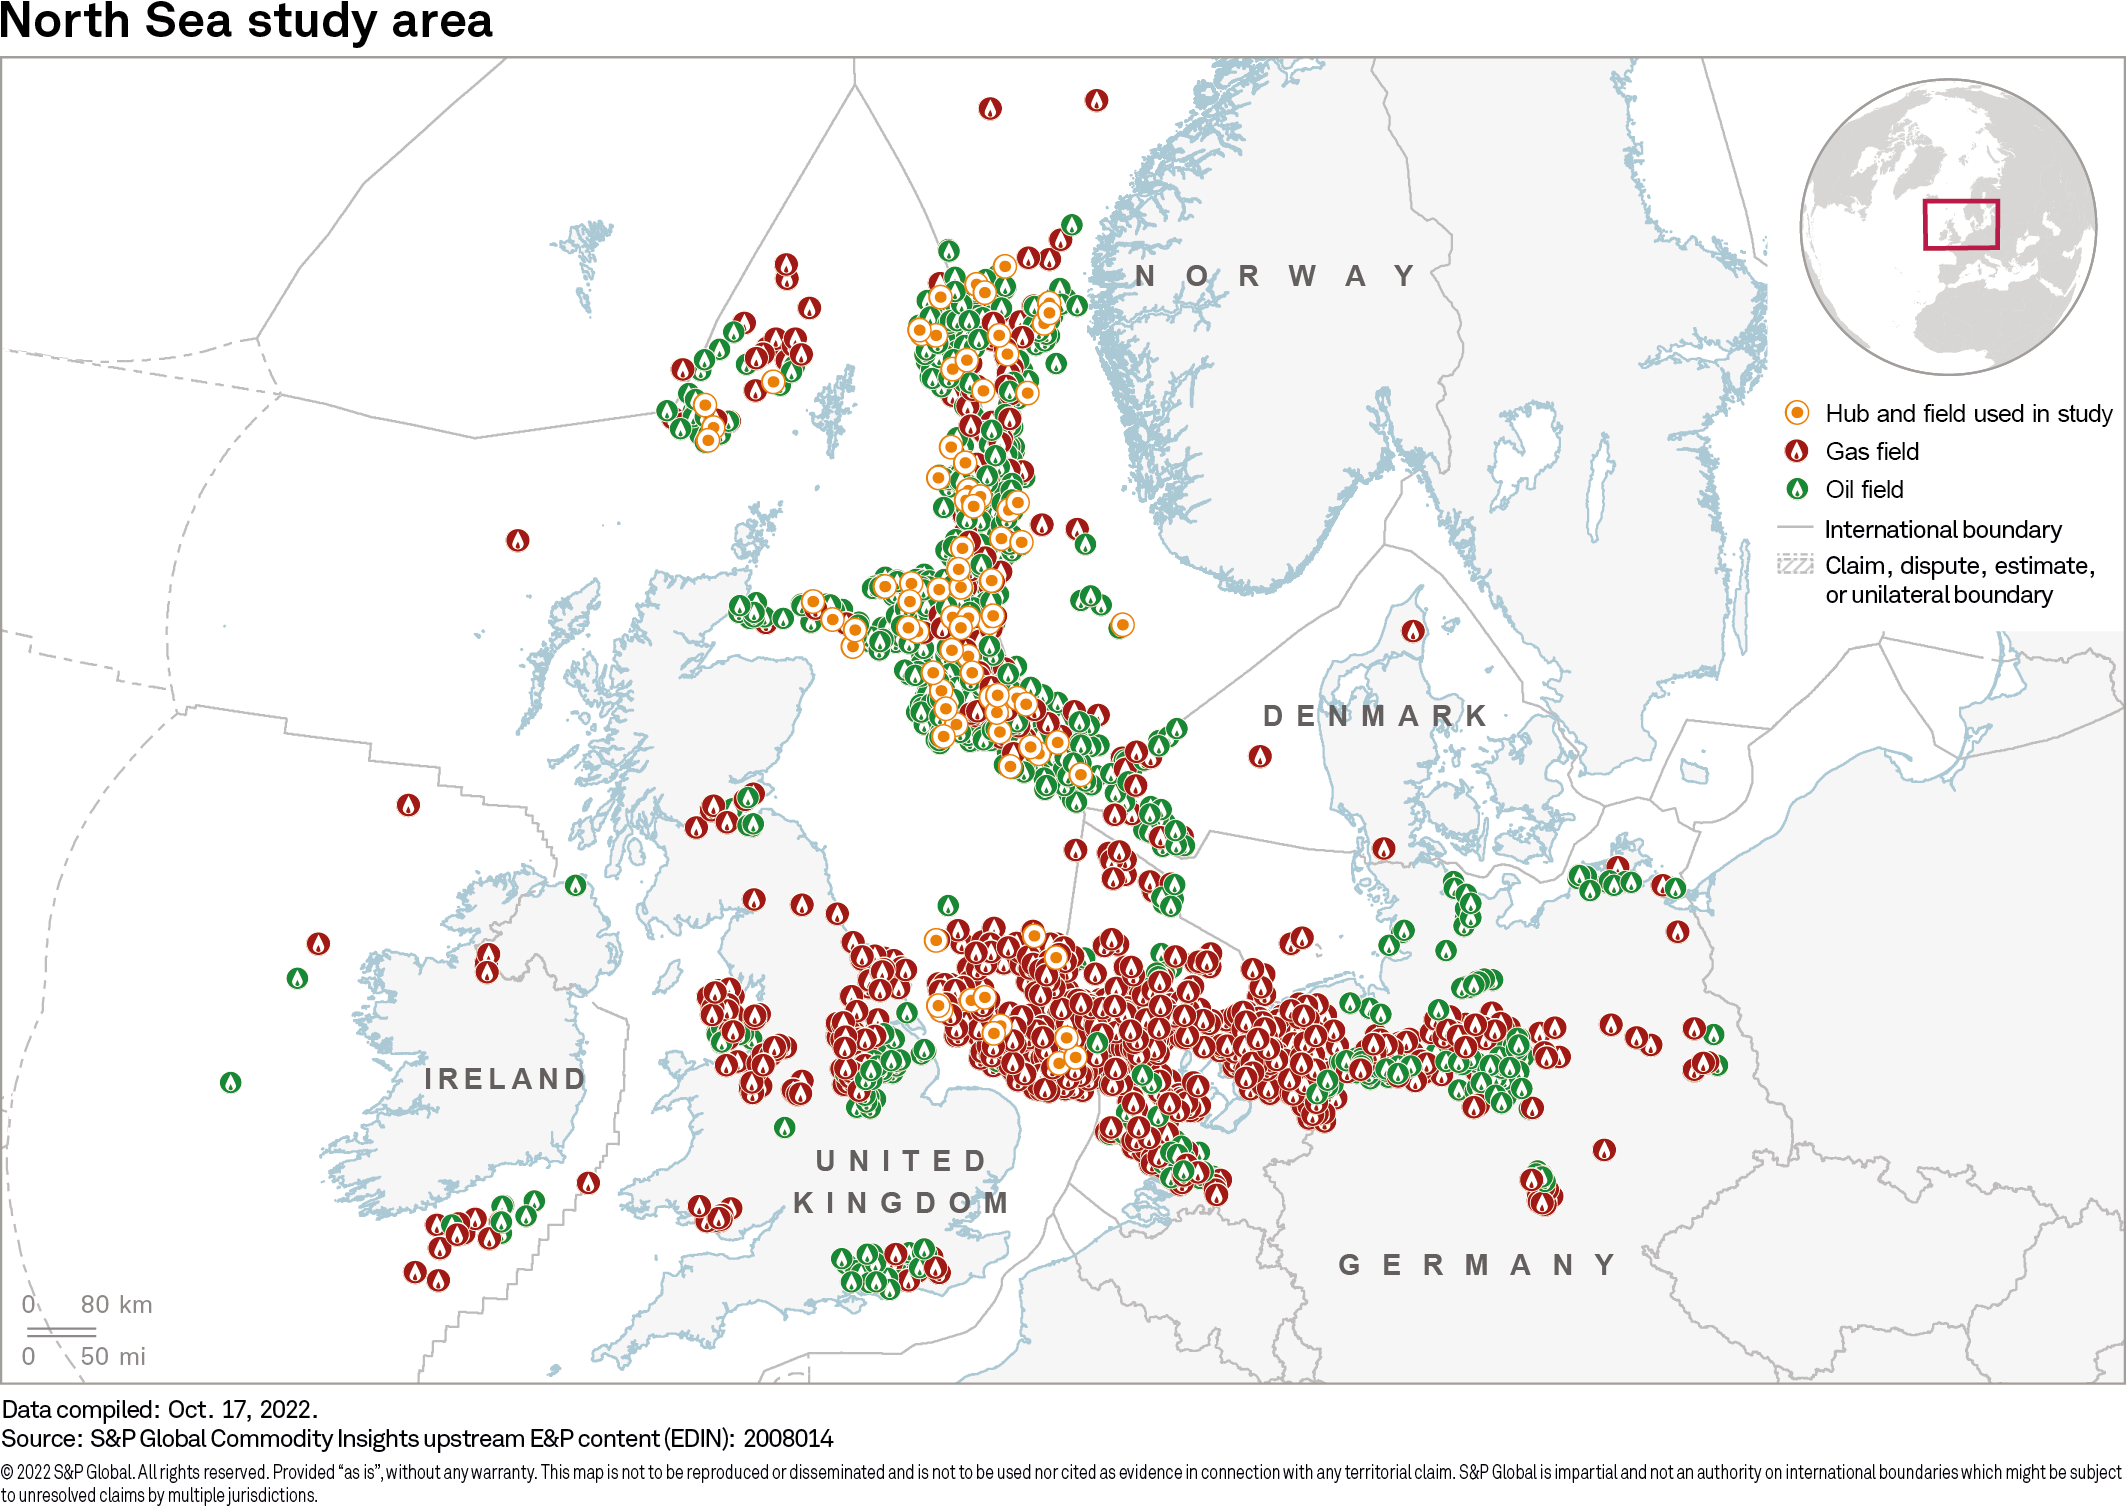
North Sea upstream operations are typically organized around larger gathering hubs that connect out to more remote fields accessed through subsea and surface production platforms. Some of these gathering stations connect back to shore, while others may transfer crude oil directly to oceangoing tankers. The scale and complexity of operations across the basin make it an interesting region to explore upstream greenhouse gas intensity. See Figure 1 for the location of North Sea oil and gas fields and the individual hubs and fields included in this study.
Figure 1
S&P Global Commodity Insights has developed a proprietary in-house upstream greenhouse gas emissions model built atop its deep upstream databases. Emerging data sources, such as reported emissions and satellite flaring data from the Earth Observation Group, are also captured to generate an unprecedented level of emissions data granularity and understanding. Greenhouse gas emission estimates go down to individual sources, including fuels, flaring, venting and fugitives. The emissions included in our international estimates, known as system boundaries, include all direct production and processing-related emissions to the point of offloading to shuttle tanker or export via pipeline (see Figure 2). Carbon dioxide, methane and nitrous oxide are the three main greenhouse gases that have been included as part of a carbon dioxide equivalent (CO2e). Methane and nitrous oxide were converted to 25 CO2e and 298 CO2e, respectively, using global warming potentials from the U.N. Intergovernmental Panel on Climate Change’s "Fourth Assessment Report". Estimates in the international emissions data set currently are based only on Scope 1 direct emissions but will soon include treatments to consider implications of Scope 2 emissions.
Emissions are quantified for each individual facility/asset. For this analysis, individual asset emissions have been allocated to their respective hub where applicable. This perspective allows the performance of the production, gathering, processing and transportation centers, and the fields/facilities tied into them, to be analyzed and compared across the region irrespective of ownership.
Figure 2
All major producing fields within the U.K. and Norwegian sectors of the North Sea have been included in this analysis, as well as those in the West of Shetlands. Stand-alone developments/fields are also included but maintain the preexisting development or field name. Hubs are defined as discrete production areas that are characterized by a central facility or field that handles production from two or more surrounding fields. Operators typically refer to key hubs as production or development areas, for example, the Sleipner Area, which includes production volumes from Sleipner East, Sleipner West, Gudrun, Gina Krog, Utgard, Gungne and Sigyn. Operator-designated hub names are applied where available. Hubs without defined names are allocated the central facility/field name. Through this approach, a total of 265 producing projects have been consolidated into 84 hubs and stand-alone projects, with 64 of these in the U.K. North Sea and the remaining 20 in the Norwegian North Sea. In terms of production volumes, 1,127 MMboe is accounted for by the Norwegian coverage and 492 MMboe for the U.K., of which 55 MMboe is from the West of Shetlands and 48 MMboe from the Southern North Sea gas basin (see Figure 3).
With the acceleration of global ambition to tackle climate change, there is increasing need by market participants to better understand the greenhouse gas competitiveness, or the relative greenhouse gas intensity between different sources of crude oil globally. This data is essential to help governments and investors understand the competitiveness of oil and gas assets, and for companies, as well as buyers and sellers of the potential carbon cost between different commodities.
The hub and spoke system found the in the North Sea influences the greenhouse gas intensity of the resulting marketed products. Although each individual production operation may have its own unique greenhouse gas intensity, the intensity of some key transportation hubs or terminals can represent a compilation of various fields. S&P Global Commodity Insights modeled each production operation to estimate the greenhouse gas intensity of all major hubs and fields. From this, it is possible to complete a comprehensive analysis of the entire producing region.
Figure 3
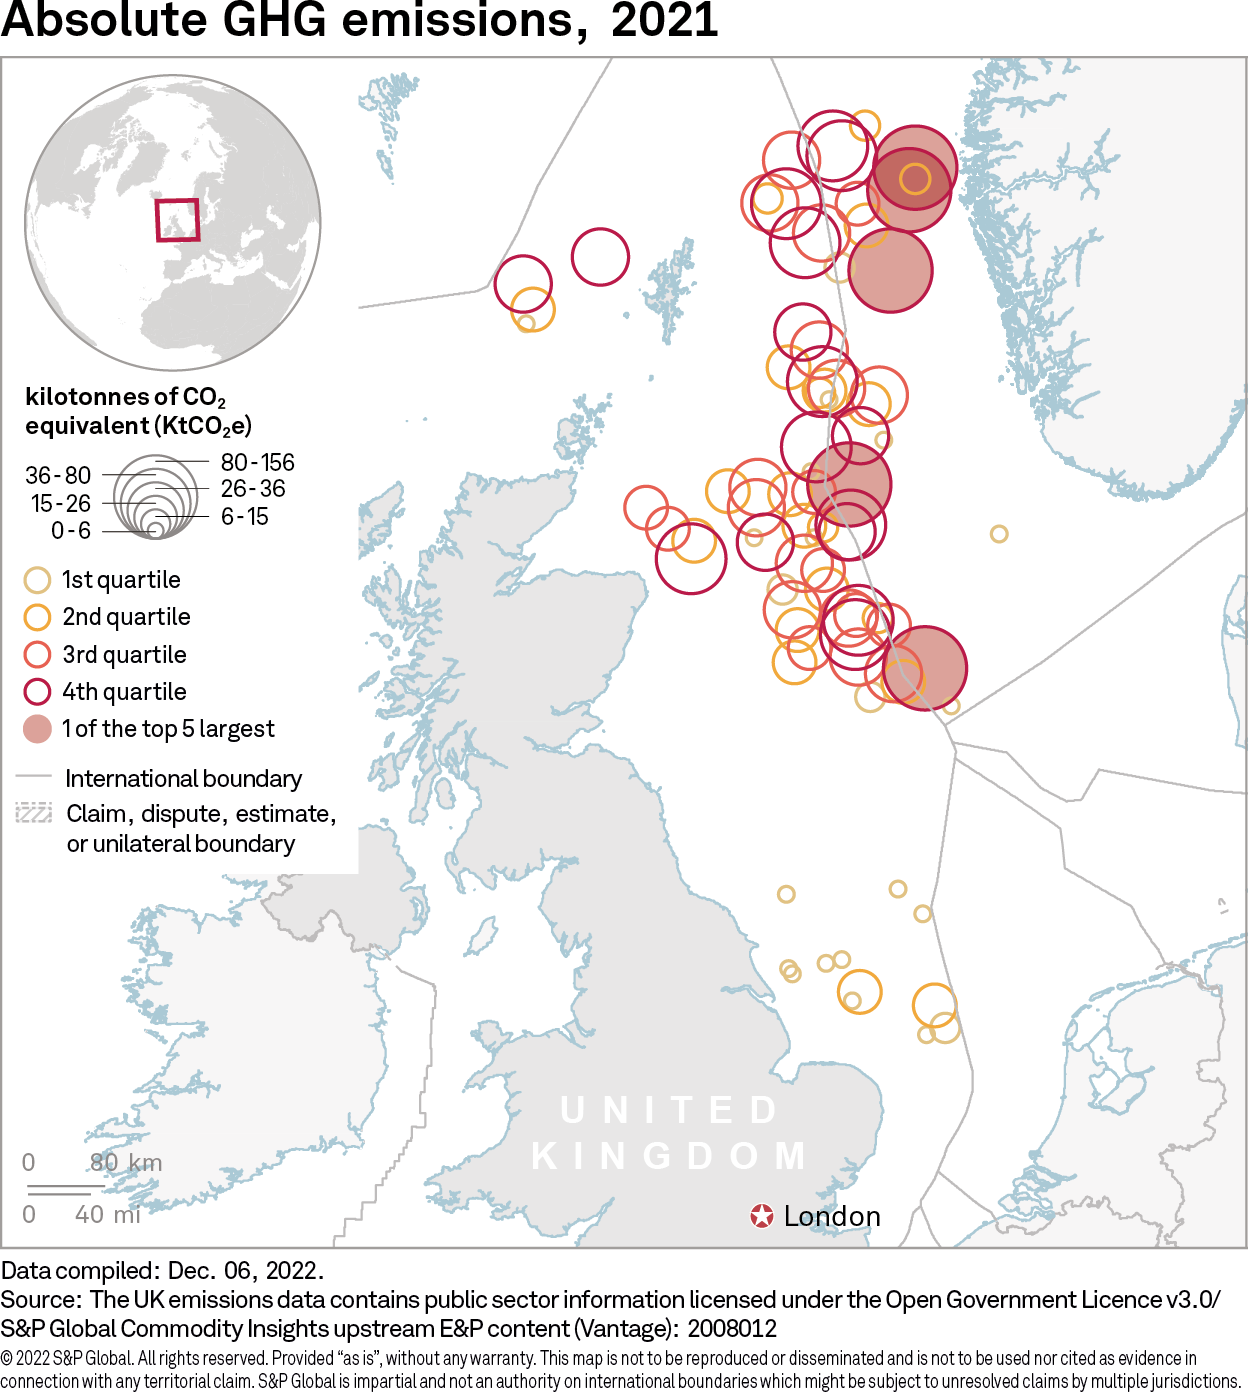
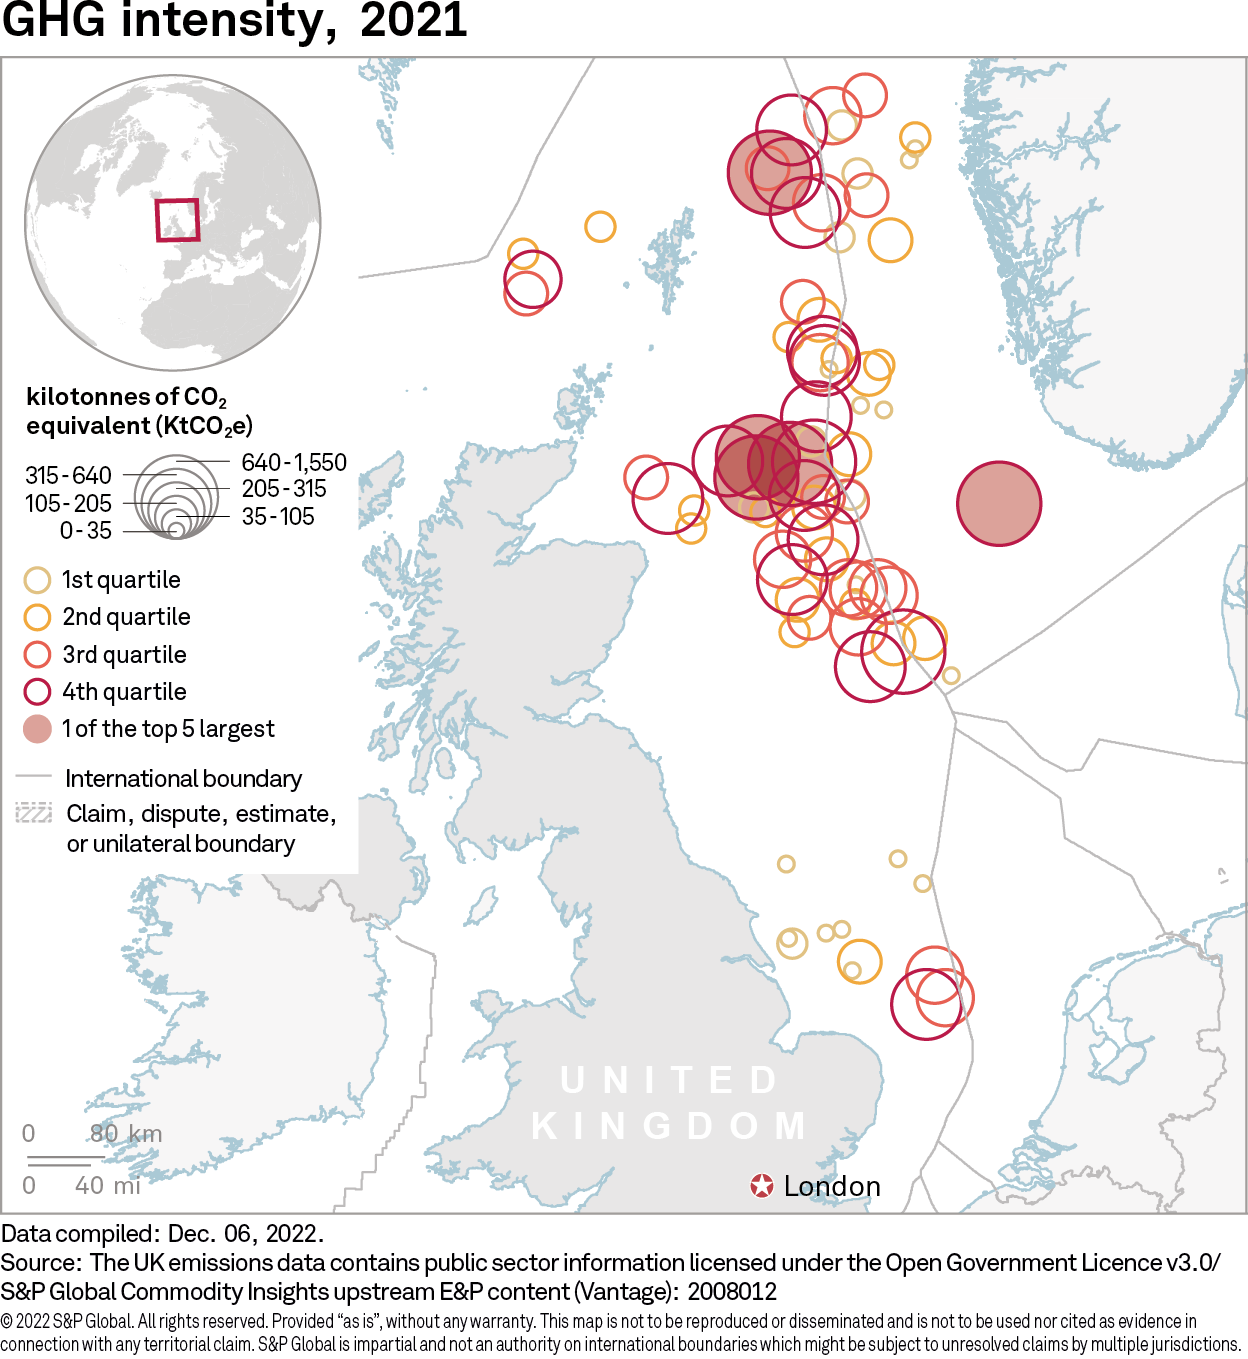
The distribution of absolute emissions and emissions intensity across the study area are displayed in Figures 4 and 5. Some of the largest individual emitting hubs/fields in absolute terms were located in the Norwegian North Sea, whereas many of the largest emitters by intensity were located in the U.K. The five largest sources of absolute emissions in 2021 were located on the Norwegian Continental Shelf. However, four of the top five greenhouse gas intensity assets were in U.K. waters. The discrepancy between these two underscores production’s role in a greenhouse gas intensity metric. Out of the 30 most intensive hubs, 29 were in the U.K., and out of the top 50, only seven were in Norway. In the U.K., the southern North Sea gas basin and West of Shetlands were advantaged in terms of emissions intensity.
Figure 4 and Figure 5

As shown in Figure 6, when production volumes are plotted against emissions intensity for individual hubs, a distinctive hockey stick pattern emerges. Overall, the average greenhouse gas intensity of the upstream North Sea production in 2021 is estimated to be 12 kgCO2e/boe, which includes both natural gas and liquids.
Figure 6
Similar to other basins globally, considerable variation in the greenhouse gas intensity exists, ranging from less than 1 kgCO2e/boe to nearly 150 kgCO2e/boe. As Figure 5 shows, the most productive and efficient hubs and projects accounted for nearly two-thirds (62%) of output, with greenhouse gas intensity being below average. The more mature and/or geologically complex fields are more numerous, have lower productivity, and thus have higher greenhouse gas intensity. Greenhouse gas intensity, after all, is a simple ratio of emissions over productivity, so as productivity declines, emissions intensity tends to increase. This is a relationship that can be observed in numerous fields within the study area and globally. In addition to declining productivity, the implementation of energy-intensive enhanced recovery techniques, increased drilling to maintain productivity and aging technology may also put upward pressure on emissions intensity.
The lower bound of the greenhouse gas intensity of North Sea production is particularly illustrative of the importance of productivity in an intensity metric as well, with a total of four assets having an estimated greenhouse gas intensity of less than 1 kgCO2e/boe, remarkably low the world over. Collectively, these four operations accounted for 13% of the study area’s production in 2021. A significant contributor to the sub-1 kgCO2e/boe intensity production club, 97% by 2021 production volume, is the giant Johan Sverdrup field in Norway, which reached this extraordinarily low value because of high productivity and electrification. In contrast, the top 10% of output on a greenhouse gas intensity basis was underpinned by 45 operations, with each having an individual greenhouse gas intensity of more than 25 kgCO2e/boe.
When viewing emissions in an absolute sense, it is clear that the larger, more productive hubs and assets accounted for a smaller proportion of emissions (see Figure 7). The 20 largest assets by production volumes in 2021 accounted for almost 80% of production but only 50% of emissions. Of the 20 assets, 13 were in Norway and the remaining seven were in the U.K. The remaining 64 assets generated 50% of emissions and produced 20% of the total volumes in 2021, with 57 of these in the U.K. and seven in Norway.
Figure 7
Breaking apart the North Sea by Norwegian or U.K. production shows that, on average, U.K. production has roughly 2.5 times the greenhouse gas intensity of Norway. Norwegian production averaged about 8 kgCO2e/boe in 2021 versus the U.K. at 23 kgCO2e/boe (see Figure 8). Excluding the Southern North Sea and West of Shetlands pushes the U.K. North Sea up to 26 kgCO2e/boe.
Norwegian operations were advantaged on a greenhouse gas intensity basis as, on average, fields tended to be less mature, with a greater share of output from larger, more productive and technologically advanced operations. Additionally, Norway benefited from electrification projects that tie back to Norway’s relatively low-emission, hydro-dominated power grid. Carbon capture and sequestration has also been deployed at the Sleipner East field, lowering emissions.
U.K. output by comparison tended to be from smaller, more mature or more challenging fields as well as from fields with older infrastructure and technology, which resulted in lower productivity and, thus, higher greenhouse gas intensity. In addition to this, operations in the U.K. were more flaring intensive, and unlike Norway, the U.K. had no power from shore projects to offset emissions from fuel combustion. However, it is notable that the gas-dominated Southern North Sea and relatively low emissions production from Quad 204 and Clair in the West of Shetlands made these two provinces significantly less intensive than the U.K. North Sea (see Figure 9).
Figure 8
Figure 9
When viewing the share of emissions by the underlying fuel or emissions source — i.e., fuel gas, diesel, flaring and venting — there is a clear distinction between Norway and the U.K. (see Figures 10 and 11). The intensity of all sources of emissions was higher for the U.K. The proportion of emissions by source also differed between the nations. Strict controls on flaring and venting activity on the Norwegian Continental Shelf mean that these sources only took up 9% of emissions in the Norwegian sector of the study area. Yet in the U.K., where zero-routine flaring regulations are not currently in place, flaring and venting accounted for 28% of total emissions in 2021.
Figure 10
Figure 11
S&P Global Commodity Insights' comprehensive upstream greenhouse gas estimation capability is shedding new light and understanding on the true nature of upstream greenhouse gas emissions. The ability to take a comprehensive view of an entire region or basin enables a complete statistical analysis of the weighted average from a range of emission intensities that, in this study, span nearly 150 kgCO2e/boe. The detail available through this new modeling approach, which is only available from S&P Global Commodity Insights, allows for detailed exploration across the region and elsewhere globally, enabling an analysis of production at multiple scales, including national level and basin level, as well as providing data rich enough to drill down to individual assets, emission sources and greenhouse gases. This is the first in a series of analyses of a brand new upstream greenhouse gas data set from S&P Global Commodity Insights.