S&P Global Offerings
Featured Topics
Featured Products
Events
S&P Global Offerings
Featured Topics
Featured Products
Events
S&P Global Offerings
Featured Topics
Featured Products
Events
Featured Products
Ratings & Benchmarks
By Topic
Market Insights
About S&P Global
Corporate Responsibility
Culture & Engagement
Investor Relations
Featured Products
Ratings & Benchmarks
By Topic
Market Insights
About S&P Global
Corporate Responsibility
Culture & Engagement
Investor Relations
S&P Global Offerings
Featured Topics
Featured Products
Events
Language
S&P Dow Jones Indices — 10 Mar, 2020
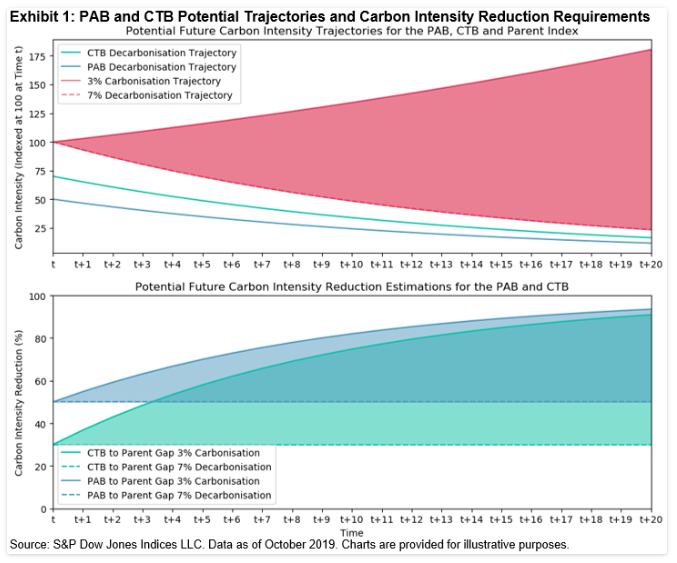
To meet the proposals for CTBs or PABs,[1]—as published by the EU Technical Expert Group (TEG) in its Final Report,[2] —active share[3] and therefore tracking error are uncertain over time,[4] due to the TEG’s absolute decarbonization proposal.[5] This blog assesses the S&P Eurozone Paris-Aligned Climate Index Concept’s (PAC Concept) potential active share sensitivity to future decarbonization, to align with a 1.5 °C scenario.[6] Exhibit 1 shows future PAB and CTB trajectories and possible parent index trajectories from 7% decarbonization and 3% carbonization. If in twenty years the parent index carbonizes at 3% year-on-year, a 90% relative carbon reduction will be required for the PAB (hopefully far higher than will be observed).
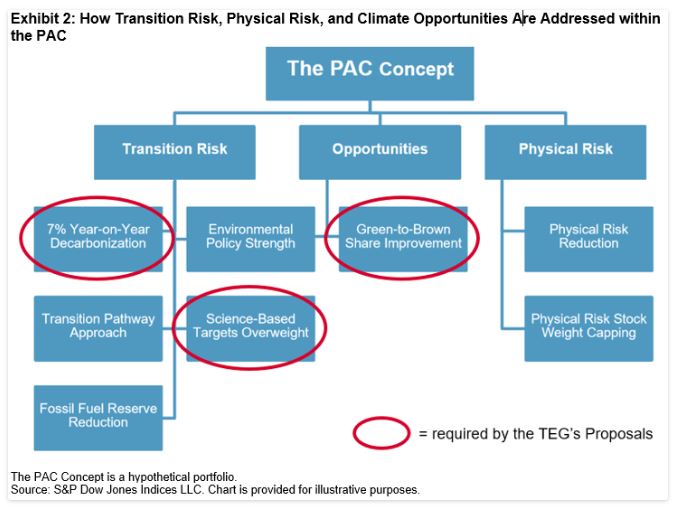
In January, S&P Dow Jones Indices released a paper(opens in a new tab) for the PAC Concept—designed not only to meet the TEG’s proposals for PABs but incorporate transition risk, physical risk, and climate opportunities, as recommended by the TCFD7 (see Exhibit 2).
Baskets have been calculated using the methodology outlined,[8] with 50%-90%[9] decarbonization constraints. The aim is understanding how potential future relative carbon reductions, due to 7% year-on-year decarbonization, will affect diversification and active share of the PAC Concept.[10] The PAC Concept active share sensitivity analysis has been calculated with all other constraints held constant.[11]
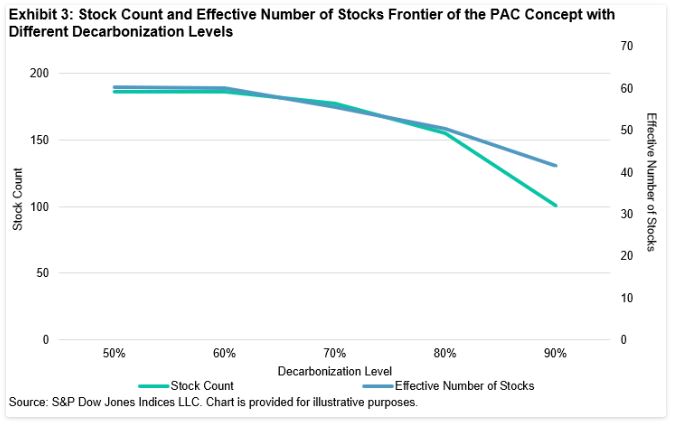
Exhibit 3 shows the stock count and effective number of stocks[12] at each level of decarbonization. As decarbonization increases, the number of stocks decrease—this decrease in stock count is gradual until 90% decarbonization, which would be an extreme level of decarbonization. Furthermore, as stock count decreases, the effective number of stocks decreases at a slower rate—meaning the PAC Concept methodology allows concentration to increase at a slower rate than stock count decreases. Even at 90% decarbonization, which is very high, there is still reasonable diversification within the PAC Concept.
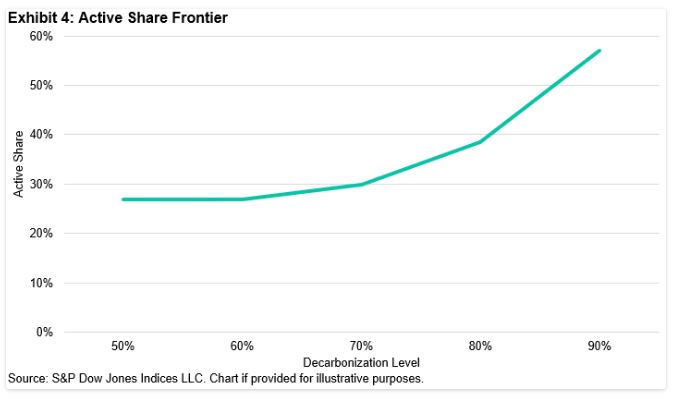
Exhibit 4 shows the sensitivity of active share as decarbonization increases. We can see a similar story as in Exhibit 3, where decarbonization up until 70% has a small impact on active share, and only when 90% decarbonization is targeted does active share jump.
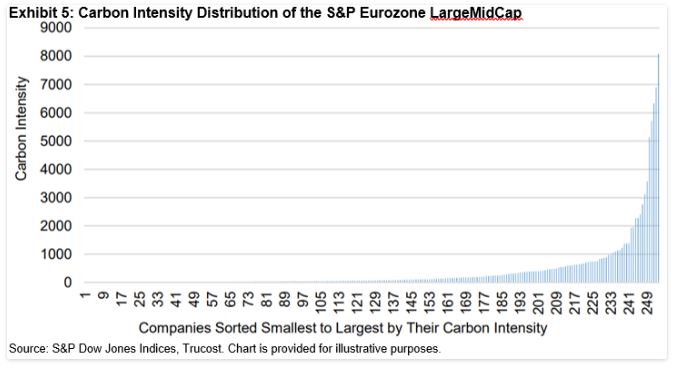
Why is there a non-linear relationship between decarbonization and active share/effective number of stocks/stock count? Exhibit 5 shows the carbon intensity distribution for companies in the S&P Eurozone LargeMidCap, which have a heavy positive skew. This skew means decarbonization until a certain point does not require much active share. As decarbonization requirements increase, it takes more active share to meet the decarbonization constraint. When more significant weight can be taken out of high-emitting companies, this causes a large impact on the PAC Concept’s carbon footprint. However, as carbon reduction requirements grow, there is little or no weight to be taken from these highest-emitting companies, so weight must be taken from less carbon-intensive companies. This weight reduction in less carbon-intensive companies has a lower impact on the carbon footprint.
Overall, the PAC Concept appears to be able to decarbonize by an amount that is in line with a worst likely scenario, without causing drastically poorer diversification.
1 Regulation (EU) 2019/2089 has created two new categories of benchmark; Regulation (EU) 2019/2089 has created two new categories of benchmark; and the EU Climate-Transition Benchmark.
2 The EU Technical Expert Group on Sustainable Finance Final Report on Climate Benchmarks and Benchmarks’ ESG Disclosure(opens in a new tab), September 2019.
3 Active share measures how much of the parent index would have to be sold to invest in the PAC concept.  ; where w is the weight of stock i.
4 Leale-Green, B. (2019, November). The EU Climate Transition and Paris-Aligned Benchmarks: A New Paradigm. Retrieved from Indexology Blog: https://www.indexologyblog.com/2019/11/07/the-euclimate-transition-and-paris-aligned-benchmarks-a-new-paradigm/(opens in a new tab)
5 The final report published by the TEG proposes that CTBs and PABs decarbonize at 7% year-on-year, regardless of the parent index’s decarbonization. This means at any point in time, the relative carbon intensity reduction from the parent index is uncertain.
6 IPCC, 2018: Global warming of 1.5°C. An IPCC Special Report on the impacts of global warming of 1.5°C above pre-industrial levels and related global greenhouse gas emissions pathways, in the context of strengthening the global response to the threat of climate change, sustainable development, and efforts to eradicate poverty [V. Masson-Delmotte, P. Zhai, H. O. Pörtner, D. Roberts, J. Skea, P.R. Shukla, A. Pirani, W. Moufouma-Okia, C. Péan, R. Pidcock, S. Connors, J. B. R. Matthews, Y. Chen, X. Zhou, M. I. Gomis, E. Lonnoy, T. Maycock, M. Tignor, T. Waterfield (eds.)]. In Press.
7 TCFD. (2017). Final Report: Recommendations of the Taskforce on Climate Related Financial Disclosures(opens in a new tab).
8 Leale-Green, B., & Cabrer, L. (2020). Conceptualizing a Paris-Aligned Climate Index for the Eurozone. S&P Dow Jones Indices. Retrieved from https://spindices.com/documents/research/research-conceptualizing-a-paris-aligned-climate-index-for-the-eurozone.pdf(opens in a new tab)
9 Analysis was performed on the S&P Eurozone LargeMidCap(opens in a new tab) universe for a hypothetical rebalance in November 2019.
10 All other data has been held constant; in the future, other datasets in the PAC Concept will change, as will the parent index constituents and weights. Therefore, more or less active share may be required to hit the same levels of decarbonization in the future.
11 The constraints aim to meet the proposal for PABs and introduce transition risk, physical risk, and climate opportunities, as laid out by the TCFD.
12 The effective number of stocks (EN) is a measure of index concentration. EN is calculated as: ; where w is the weight of stock i. The lower the value for EN, the more concentrated the index. The value for EN will fall between 1 and the number of stocks in the index (if the stocks are equally weighted).


