Featured Topics
Featured Products
Events
S&P Global Offerings
Featured Topics
Featured Products
Events
S&P Global Offerings
Featured Topics
Featured Products
Events
S&P Global Offerings
Featured Topics
Featured Products
Events
Language
Featured Products
Ratings & Benchmarks
By Topic
Market Insights
About S&P Global
Corporate Responsibility
Culture & Engagement
Featured Products
Ratings & Benchmarks
By Topic
Market Insights
About S&P Global
Corporate Responsibility
Culture & Engagement
S&P Dow Jones Indices — 4 Jun, 2020
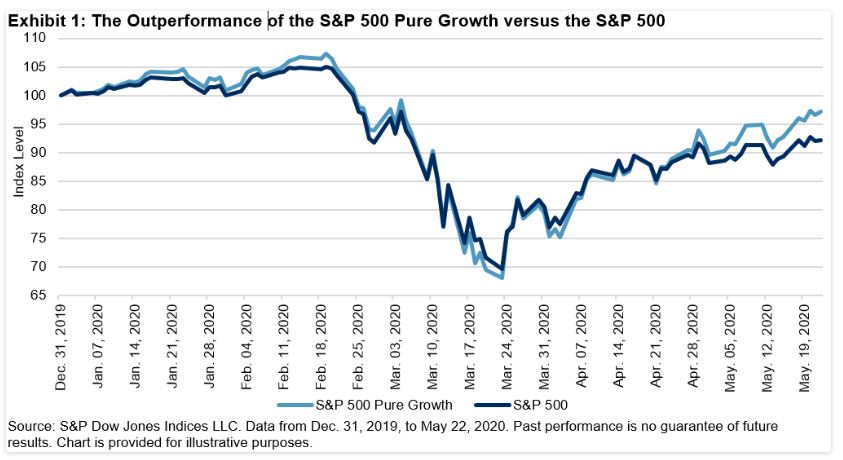
The S&P 500® has had a wild ride in 2020. The index hit an all-time high in February, then dropped 33.8% to the bottom in March due to the COVID-19 pandemic, and then rallied 32.6% by May 22. During this turbulent time, the S&P 500 Pure Growth, while declining along with markets, ultimately outperformed its benchmark by 4.92% (see Exhibit 1). The following analysis investigates attributes of this outperformance.

The S&P Pure Growth Index Series uses the following three components to define overall pure growth scores, and constituents are weighted based on their style scores:[i]
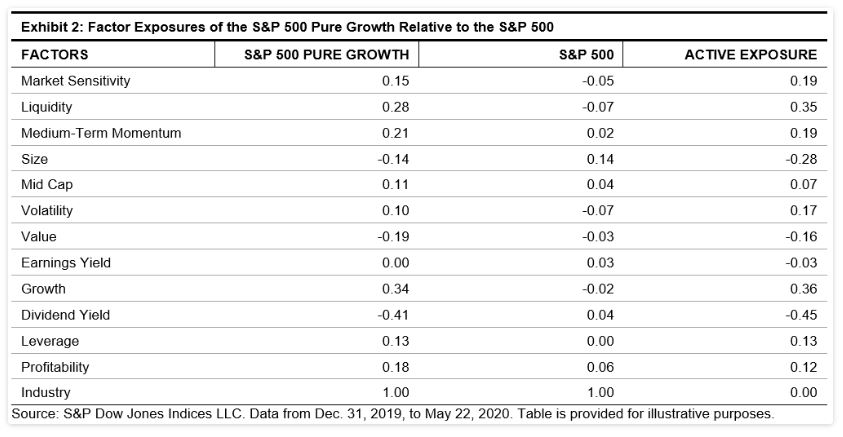
To better understand the characteristics of the S&P Pure Growth Index Series, we use a commercially available fundamental risk model to capture risk exposures. We measure active exposures of the S&P 500 Pure Growth relative to the S&P 500 (see Exhibit 2).
The S&P 500 Pure Growth had the highest positive tilt toward growth (0.36), followed by liquidity (0.35), medium-term momentum (0.19), and market sensitivity (0.19). Results were broadly in line with the index design . Moreover, the S&P 500 Pure Growth constituents tended to have higher return volatility, higher leverage, and better profitability.
On the other hand, the index was most underweight to the dividend yield factor (-0.45), followed by the size (-0.28) and value (-0.16) factors. This means that companies in the S&P 500 Pure Growth had lower dividend yields, tended to be smaller size, and had higher valuations than companies in the S&P 500 universe.

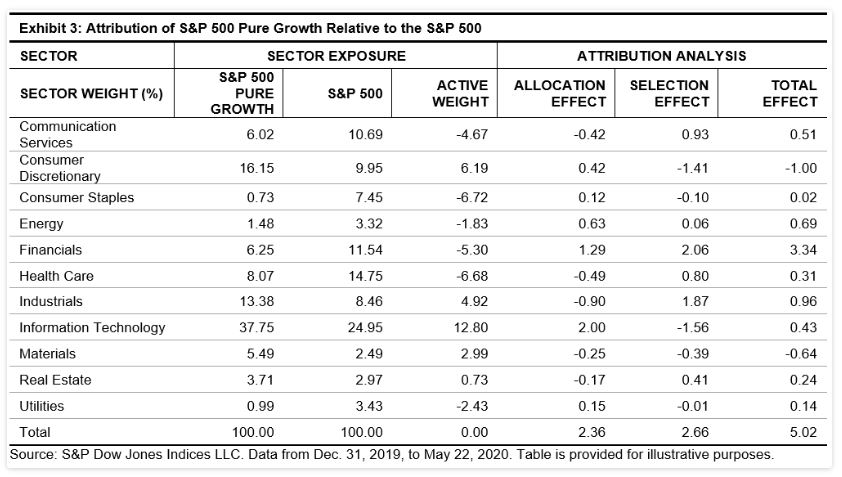
We next decompose excess returns of the S&P 500 Pure Growth into sector allocation and security selection of index constituents.
From Exhibit 3, we see the index was historically overweight in Information Technology (12.80%), Consumer Discretionary (6.19%), and Industrials (4.92%). In contrast, it was underweight in Consumer Staples (-6.72%), Health Care (-6.68%), Financials (-5.30%), and Communication Services (-4.67%) relative to the S&P 500.
The total performance effect was about 5%, with almost half of that coming from sector-allocation effects (2.36%). Information Technology and Financials had the highest sector effects of 2.00% and 1.29%, respectively. On the other hand, more than half of the outperformance came from selection effect (2.66%). Selection effect measures added value of security selection within a sector. The results showed that the methodology of the S&P 500 Pure Growth led to better-performing securities.

In conclusion, the S&P 500 Pure Growth outperformed its benchmark during this volatile period. This was mainly driven by positive exposure to growth and momentum and negative exposure to dividend and earning yields. Overall, sector allocation and security selection contributed to the outperformance.
[i] The detailed factor definition and index construction are laid out in the S&P 500 Pure Growth Methodology.
Content Type
Theme
Location
Language