S&P Global Offerings
Featured Topics
Featured Products
Events
S&P Global Offerings
Featured Topics
Featured Products
Events
S&P Global Offerings
Featured Topics
Featured Products
Events
S&P Global Offerings
Featured Topics
Featured Products
Events
Language
Featured Products
Ratings & Benchmarks
By Topic
Market Insights
About S&P Global
Corporate Responsibility
Diversity, Equity, & Inclusion
Featured Products
Ratings & Benchmarks
By Topic
Market Insights
About S&P Global
Corporate Responsibility
Diversity, Equity, & Inclusion
S&P Dow Jones Indices — 21 May, 2020
By Berlinda Liu
In addition to absolute returns, institutional investors also evaluate active funds by risk-adjusted returns. This is not surprising since Modern Portfolio Theory tells us that higher returns tend to be associated with higher risk.
Our Risk-Adjusted SPIVA Scorecard was introduced in 2018 as an extension of the standard SPIVA Scorecards.
Now, let’s look at the most recent report from year-end 2019.
U.S. Equity Funds: Scarce Outperformance
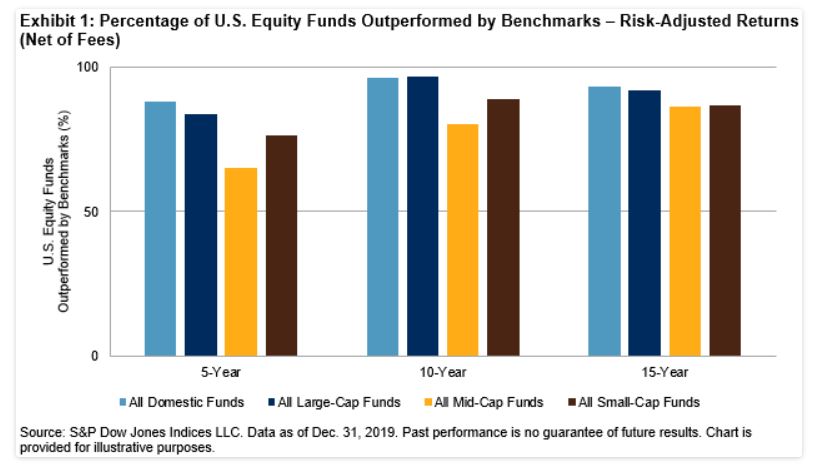
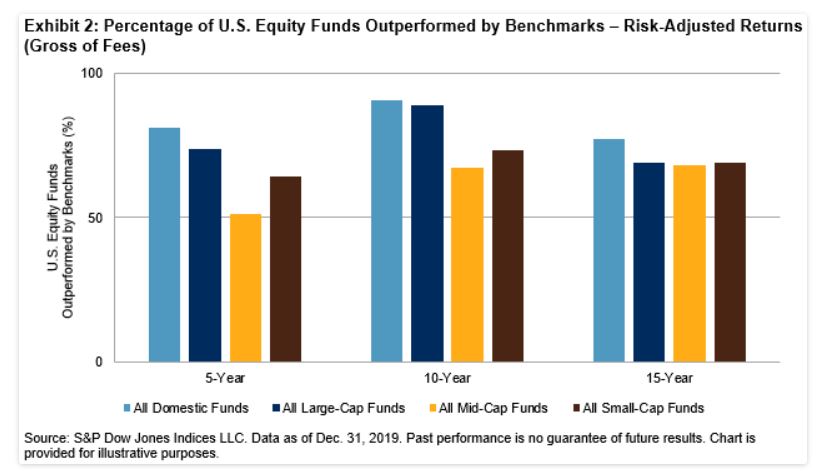
The Risk-Adjusted SPIVA Year-End 2019 Scorecard shows that, after adjusting for risk, most U.S. Equity Funds across all categories underperformed their benchmarks over mid- and long-term investment horizons, net of fees. Even on a gross-of-fees basis, outperformance only appeared in a few categories: Real Estate (over 5 and 15 years), Large-Cap Value (over 15 years), and Mid-Cap Growth funds (over 5 years). This is particularly noteworthy since the equity market was experiencing one of the longest bull markets during this period, with S&P 500® gaining 257%.


As in the U.S., most international equity funds across all categories generated lower risk-adjusted returns than their benchmarks when using net-of-fees returns. On a gross-of-fees basis, only International Small-Cap funds outperformed over the 10- and 15-year periods.

Fees played a critical role in fixed income fund performance. When using net-of-fees risk-adjusted returns, most actively managed fixed income funds in most categories underperformed over all three investment horizons. The exceptions were Government Long, Investment Grade Long, and Loan Participation funds (over 5 and 10 years), as well as Investment Grade Short funds (over 5 years). However, unlike their equity counterparts, most fixed income funds outperformed their respective benchmarks gross of fees.
On a net-of-fees basis, asset-weighted return/volatility ratios for active portfolios were higher than the corresponding equal-weighted ratios, indicating that larger firms have taken on better-compensated risk than smaller ones.
On a gross-of-fees basis, most fund categories produced higher return/volatility ratios than their benchmarks when equally weighted. However, their outperformance diminished once fees or fund size were accounted for, especially in domestic and international equity funds. In general, equal-weighted return/volatility ratios improved more than the corresponding asset-weighted ratios when fees were ignored, indicating that fees played a prominent role in smaller funds’ performance.
While our SPIVA Scorecards typically show that active funds underperform their benchmarks in absolute returns, defenders often argue that active funds may be superior to passive investment after adjusting for risk. The Risk-Adjusted SPIVA Year-End 2019 Scorecard demonstrates that history showed us quite the opposite: most active funds lagged their benchmarks over the long term, and exceptions were even more scarce when fees were counted for.
Content Type
Theme
Location
Language