S&P Global Offerings
Featured Topics
Featured Products
Events
S&P Global Offerings
Featured Topics
Featured Products
Events
S&P Global Offerings
Featured Topics
Featured Products
Events
S&P Global Offerings
Featured Topics
Featured Products
Events
Language
Featured Products
Ratings & Benchmarks
By Topic
Market Insights
About S&P Global
Corporate Responsibility
Diversity, Equity, & Inclusion
Featured Products
Ratings & Benchmarks
By Topic
Market Insights
About S&P Global
Corporate Responsibility
Diversity, Equity, & Inclusion
S&P Dow Jones Indices — 25 Mar, 2020
By Izzy Wang
This article is reprinted from the Indexology blog of S&P Dow Jones Indices.
The S&P Balanced Global Bond and Equity Futures Index (the S&P BEF Index) is designed to deliver consistent returns through various market cycles by exploiting the complementarity between equities and bonds during market crisis, and adjusting the allocation to component indices on a daily basis to achieve a stable risk level (what we call a dynamic volatility control mechanism). The components are rolled futures that are highly liquid and tradable, and are as follows.
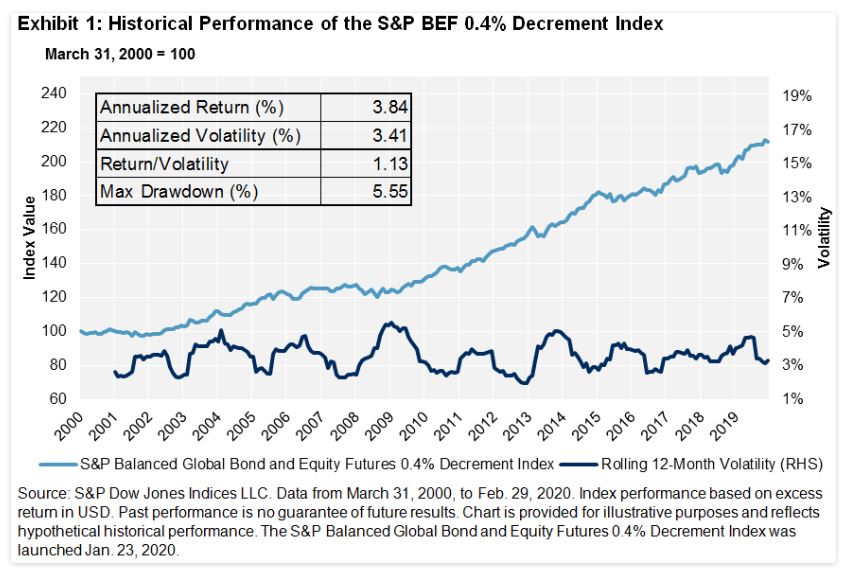
Over the past 20 years, S&P BEF 0.4% Decrement Index[1] posted an annualized return of 3.84%, a risk-adjusted return of 1.13, and a maximum drawdown of 5.55% (see Exhibit 1).
How did the index perform during historical crises?
The S&P BEF 0.4% Decrement Index posted positive returns of 2.7% during the Dot-Com Bubble Crisis and 3.6% during the Eurozone Crisis. This is in stark contrast to the significant losses posted by the S&P 500® during those periods.
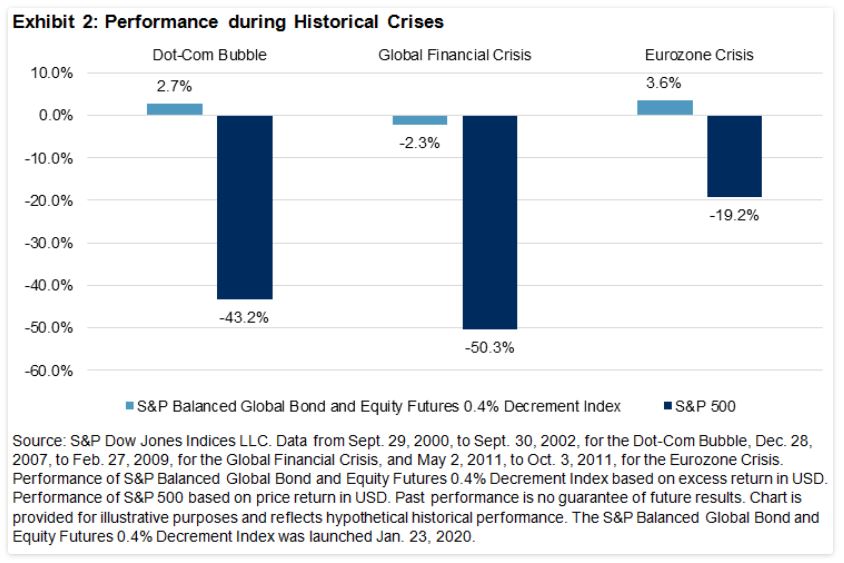
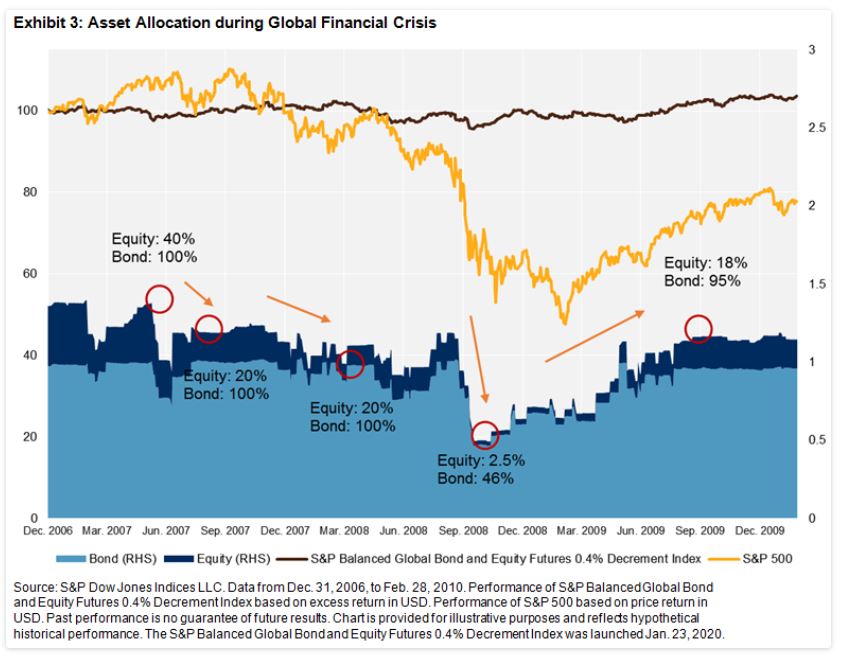
Throughout the 2008 Global Financial Crisis (GFC), the S&P BEF 0.4% Decrement Index declined 2.3%, while S&P 500 lost 50% during the same period. The index recovered rather quickly within six months compared with the four years that the S&P 500 took. The S&P BEF Index’s asset allocation around the GFC is shown in Exhibit 3.
How has the index performed so far in 2020?
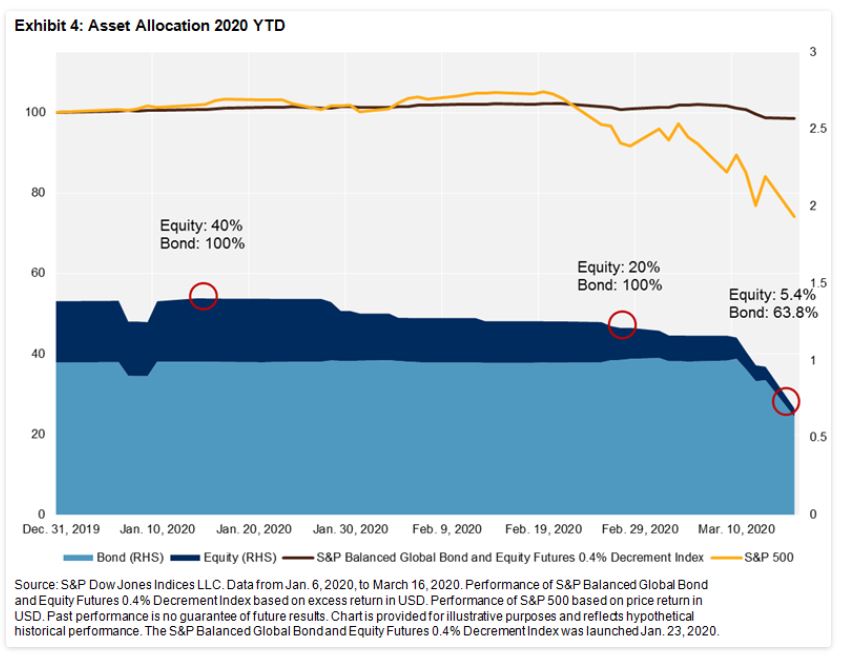
As of March 16, the S&P BEF 0.4% Decrement Index declined 1.5% YTD and was off 3.7% since February 19. In comparison, the S&P 500 plunged by 26% and 29.5%, respectively.
Similar to what happened in the GFC, the S&P BEF Index first reacted to the increasing volatility in the stock market by cutting its equity allocation from 40% on January 15 to 20% on February 28, while maintaining the bond allocation at its maximum of 100% (see Exhibit 4). During this period, bond market soared and the strategy benefited from that.
After oil prices crashed and COVID-19 was escalated to a pandemic, Treasuries started to fall on March 9 as well. To tackle the widespread volatility, the S&P BEF Index turned on “minimum investment” mode by significantly reducing allocations to both equity and bond baskets. As of March 16, 2020, the index had only 5.4% equity exposure and 63.8% bond exposure. The leverage would further decrease if the market situation worsened.
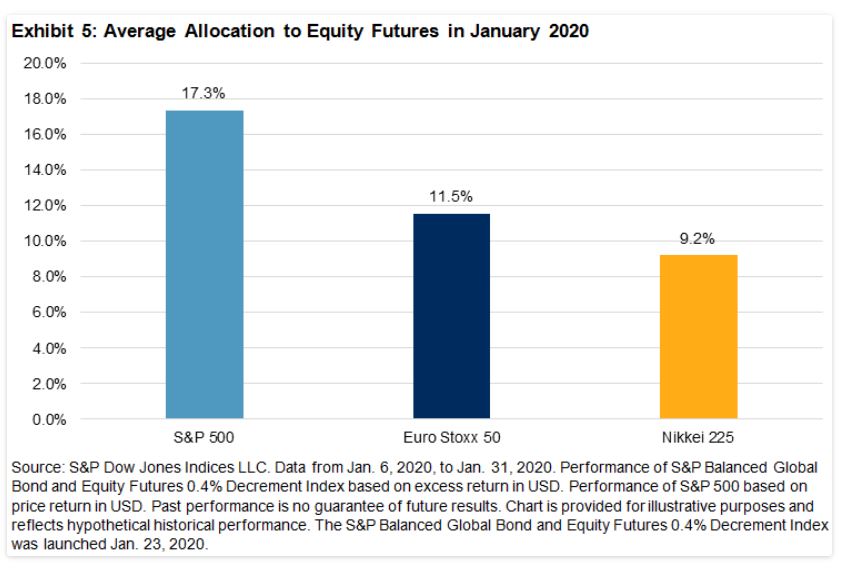
What is special about the current market environment is that the levels of volatility varied among major regions, potentially because of the different phases of virus spread. Throughout January, we saw greater volatility in Europe and Japan than in the U.S. And during this period, the index assigned an average allocation of 17.3% to S&P 500 futures, greater than the 11.5% allocated to the Euro Stoxx 50 and the 9.2% allocated to the Nikkei 225 (see Exhibit 5). By March 16, allocation to the three regional equity indices changed to 1.8% for S&P 500, 1.4% for Euro Stoxx 50, and 2.2% for Nikkei 225. Likewise, when a certain market’s volatility starts to come down, the risk control mechanism will be able to dial up the allocation to that specific region in the future.
The S&P BEF Index aims to deliver higher long-term risk-adjusted returns with a smoother wealth curve than a single asset might. Historically, it rode through the Dot-Com Bubble, 2008 GFC, and Eurozone Crisis. In 2020, the S&P BEF Index has worked well so far.
[1] The S&P BEF 0.4% Decrement Index tracks the S&P BEF Index less a fixed fee of 0.4% per year.