S&P Global Offerings
Featured Topics
Featured Products
Events
S&P Global Offerings
Featured Topics
Featured Products
Events
S&P Global Offerings
Featured Topics
Featured Products
Events
S&P Global Offerings
Featured Topics
Featured Products
Events
Language
Featured Products
Ratings & Benchmarks
By Topic
Market Insights
About S&P Global
Corporate Responsibility
Diversity, Equity, & Inclusion
Featured Products
Ratings & Benchmarks
By Topic
Market Insights
About S&P Global
Corporate Responsibility
Diversity, Equity, & Inclusion
S&P Dow Jones Indices — 3 Feb, 2021
By Liyu Zeng
This article is reprinted from the Indexology blog of S&P Dow Jones Indices.
In a previous blog, we reviewed the carbon efficiencies of Asian companies in comparison with their global industry group peers. In this blog, we examine the potential carbon intensity1 reduction on various Asian markets by incorporating a carbon weight adjustment to their respective S&P Global BMI index universes, following the S&P Global Carbon Efficient Index Series methodology. The S&P Global Carbon Efficient Index Series applies a carbon weight adjustment to companies within each GICS® industry group, which overweights (or underweights) companies with lower (or higher) levels of carbon intensity, while maintaining the respective industry group weights of their underlying indices.
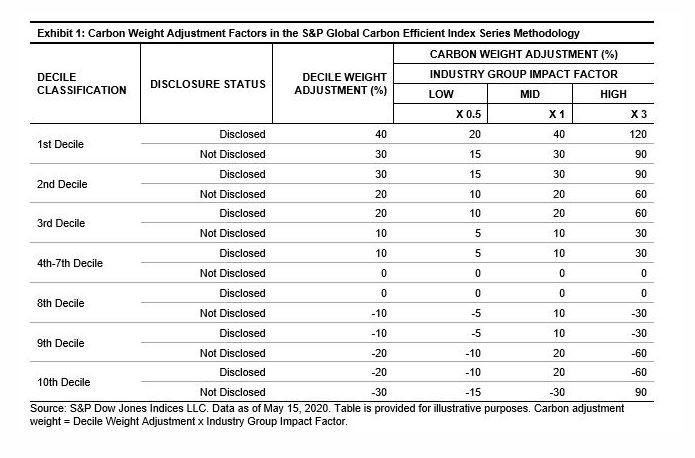
The decile weight adjustment factor for each company is assigned according to its carbon intensity decile rank based on the S&P Global Carbon Standard and its carbon data disclosure status (see Exhibit 1). Companies in high-carbon deciles (i.e., low carbon intensities) are assigned positive decile weight adjustment factors. In addition, companies that publicly disclose their carbon emission numbers receive higher decile weight adjustments than those that do not disclose, within the same decile.
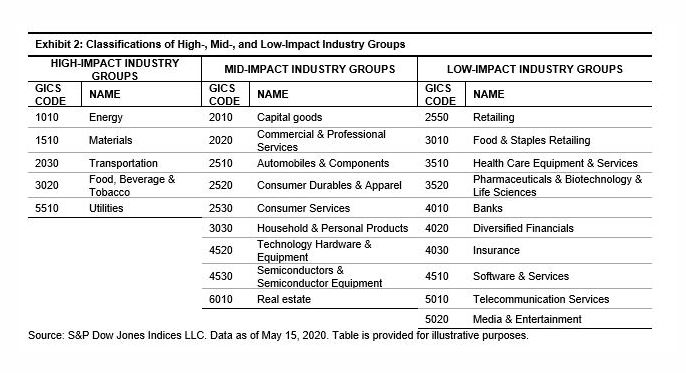
Furthermore, the decile weight adjustments are multiplied by industry group impact factors, which vary across high-, mid-, and low-impact industry groups. The industry group impact is defined by the spread of carbon intensities across companies in each industry group2 (see Exhibit 2). Carbon weight adjustments are more significant for companies in the high-impact industry groups (Energy, Materials, Transportation, Food, Beverages & Tobacco, and Utilities).


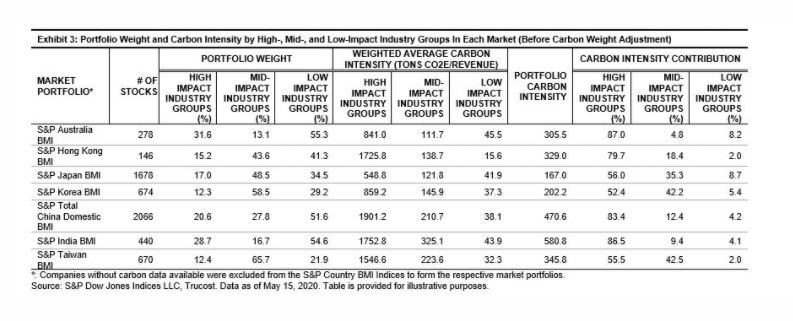
As shown in Exhibit 3, the carbon intensity of various Asian markets ranged from 167 (Japan) to 581 (India). Evidently, companies in high-impact industry groups had much higher carbon intensities than those in mid- and low-impact industry groups, and they tended to have the highest contribution to overall portfolio carbon intensity, despite the weighted-average carbon intensities of high-impact industry groups, which varied from 549 (Japan) to 1,901 (China). On the other hand, high weighting in high-impact industry groups, such as in Australia (31.6%) and India (28.7%), also drove up the overall portfolio carbon intensity.
Among various Asian markets, Japan and Korea had the lowest overall carbon intensities (167 and 202, respectively), which was largely caused by low weighting and low carbon intensities among high-impact industry groups. The opposite was seen in India and China, where the carbon intensities were much higher (581 and 471, respectively).

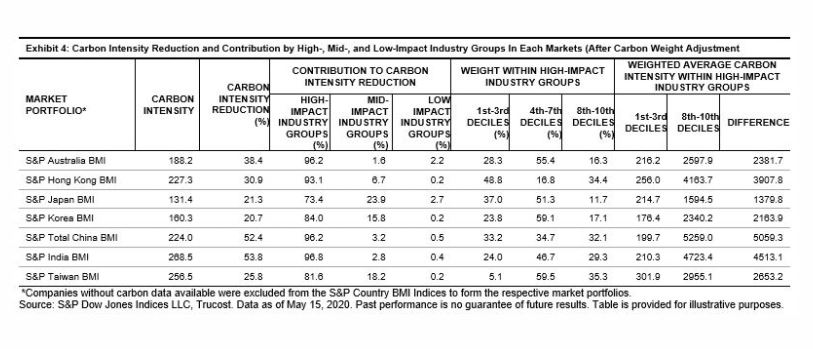
Applying a carbon weight adjustment to Asian market portfolios resulted in significant carbon intensity reductions ranging from 20.7% to 53.8%, compared with their respective market-cap-weighted market portfolios. The degree of carbon intensity reduction is largely determined by the difference in carbon intensities of companies in high- versus low-carbon deciles and the weights available for adjustment (from high- and low-carbon deciles) in the high-impact industry groups.
India and China, with high weighting in high- and low-carbon deciles and a high carbon intensity range in high-impact industry groups, had a carbon intensity reduction of over 50%. In contrast, Japan and Korea, with low weighting in low-carbon deciles and low carbon intensity range in their high-impact industry groups, had smaller reductions of 21.3% and 20.7%, respectively. Despite varying levels of carbon intensity reductions across markets, the vast majority of the carbon intensity reductions were contributed from the carbon weight adjustment on companies in the high-impact industry groups.
These results indicate that, even without any industry group weight bias, reweighting companies according to their carbon intensities and industry group impacts may achieve a significant carbon intensity reduction across Asian markets, with companies in the high-impact industry groups contributing most to the reduction.

1Company-level carbon intensity is calculated by Trucost. It is defined as a company’s annual greenhouse gas (GHG) emissions (direct and first tier indirect), expressed as tons of carbon dioxide equivalent (CO2e) in millions, divided by annual revenues. Portfolio level carbon intensity is calculated as the weighted average of company level carbon intensities.
2Each industry group is classified as high, mid or low impact based on the range of carbon-to-revenue footprints across the companies within that industry group in the S&P Global LargeMidCap. Industry groups with a range bigger/lower than 500/150 (CO2e / revenue) are considered high/low impact industry groups, while the rest are mid-impact industry groups.
The posts on this blog are opinions, not advice. Please read our Disclaimers.
Content Type
Location
Segment
Language