S&P Global Offerings
Featured Topics
Featured Products
Events
S&P Global Offerings
Featured Topics
Featured Products
Events
S&P Global Offerings
Featured Topics
Featured Products
Events
S&P Global Offerings
Featured Topics
Featured Products
Events
Language
Featured Products
Ratings & Benchmarks
By Topic
Market Insights
About S&P Global
Corporate Responsibility
Diversity, Equity, & Inclusion
Featured Products
Ratings & Benchmarks
By Topic
Market Insights
About S&P Global
Corporate Responsibility
Diversity, Equity, & Inclusion
S&P Dow Jones Indices — 3 Apr, 2020
This article is reprinted from the Indexology blog of S&P Dow Jones Indices.
Since March 9, 2020, we have seen equities and bonds fall together. As bonds fail to provide the diversification benefit in the short term, some investors may choose to use inverse exchange-traded funds as short-term trading tools for an explicit hedge.
Inverse strategies typically aim to replicate the daily performance of their underlying indices with a constant multiplicative factor (such as -1, -2, or -3). While the daily rebalancing allows the products to seek to invert the return of their underlying indices on a daily basis, returns for longer periods are a product of the compounded daily inverse returns during the period, and they could deviate significantly from the stated daily objective. Therefore, although such products offer short-term trading tools for explicit purposes, they may not be suitable as long-term holdings for some investors.
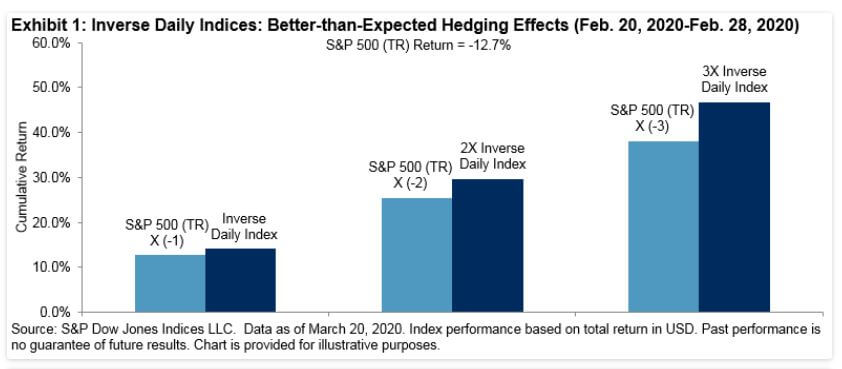
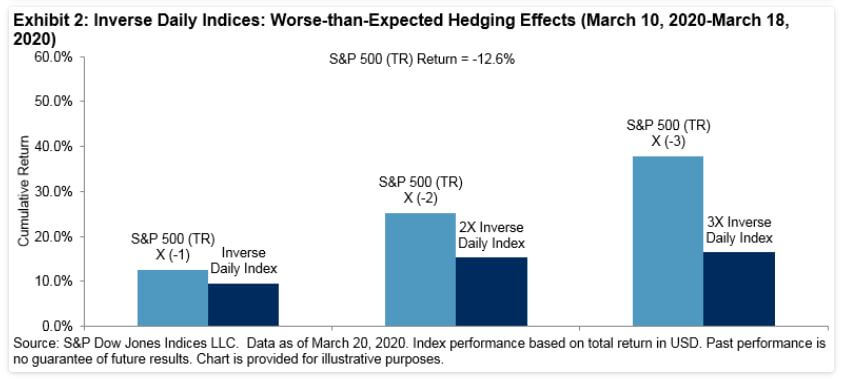
Exhibits 1 and 2 illustrate how inverse daily indices performed in two recent time periods: a period of seven trading days from Feb. 20, 2020, to Feb. 28, 2020, and another period of seven trading days from March 10, 2020, to March 18, 2020. In both periods, the S&P 500® (TR) dropped close to 13%, while the inverse daily indices’ returns were vastly different.


From Feb. 20, 2020, to Feb. 28, 2020, the S&P 500 was trending down every single trading day. In this case, or when the market was trending in one direction in general, the cumulative performance of the inverse daily indices tended to exceed the invert return of the index during the period.
However, from March 10, 2020, to March 18, 2020, the S&P 500 was trending further downward with huge daily swings (from -12% to 5%). In this case, the pursuit of daily investment targets typically had a negative impact on performance for periods longer than one day. The negative impact could have been larger for inverse indices with higher multiples.
This effect of compounding on the cumulative returns may not be trivial for many retail investors. The S&P Leverage and Inverse Indices aim to provide transparent benchmarks for leverage and inverse products.
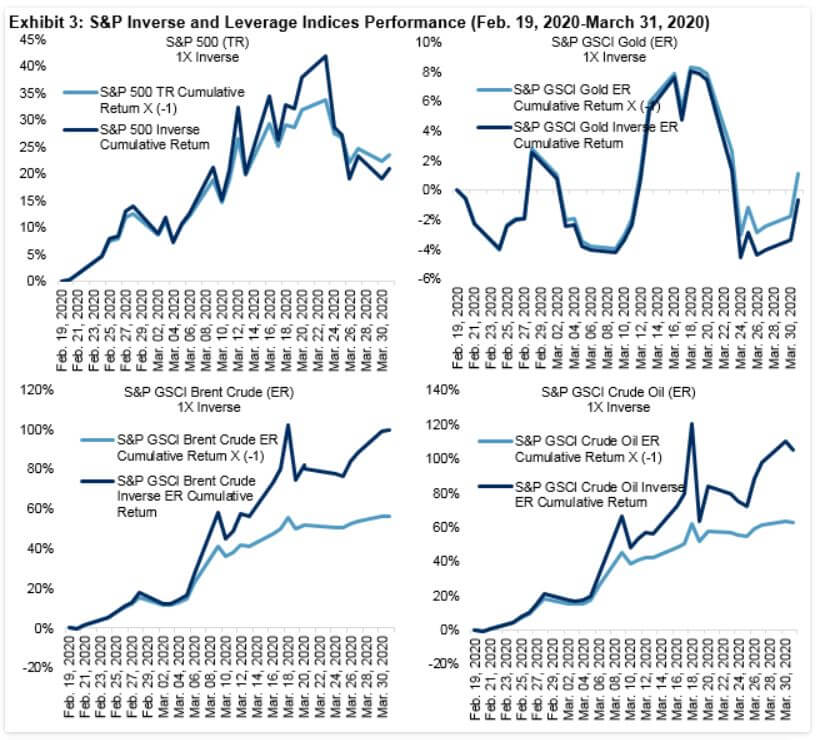
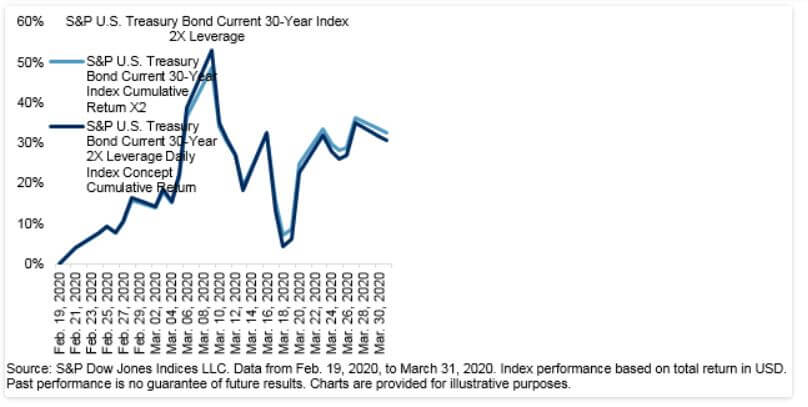
Further details on the S&P Leverage and Inverse Indices are available here: TalkingPoints: S&P Leverage and Inverse Indices. Additionally, the recent performance of key indices is displayed in Exhibit 3 (from Feb. 19, 2020, to March 31, 2020).


