Featured Topics
Featured Products
Events
S&P Global Offerings
Featured Topics
Featured Products
Events
S&P Global Offerings
Featured Topics
Featured Products
Events
S&P Global Offerings
Featured Topics
Featured Products
Events
Language
Featured Products
Ratings & Benchmarks
By Topic
Market Insights
About S&P Global
Corporate Responsibility
Culture & Engagement
Featured Products
Ratings & Benchmarks
By Topic
Market Insights
About S&P Global
Corporate Responsibility
Culture & Engagement
S&P Dow Jones Indices — 14 May, 2020
This article is reprinted from the Indexology blog of S&P Dow Jones Indices.
The S&P 500® Quality, Value & Momentum Multi-Factor Index is designed to measure the performance of stocks having the highest combination of quality, value, and momentum (QVM). It takes a “bottom-up” approach of scoring each stock on its individual factor attributes and selecting stocks that jointly score highest across all the factors [1]. In light of the recent market turbulence, let us examine the performance of this index in comparison with the alternative “top-down” approach to multi-factor portfolio construction, i.e., taking an equally weighted combination of single-factor indices, referred to as an “index of indices” (IOI)[2].
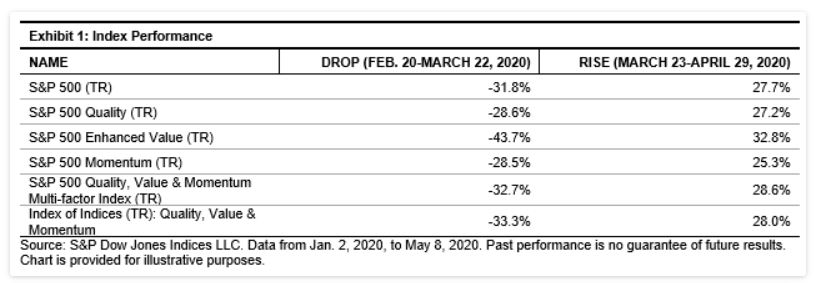
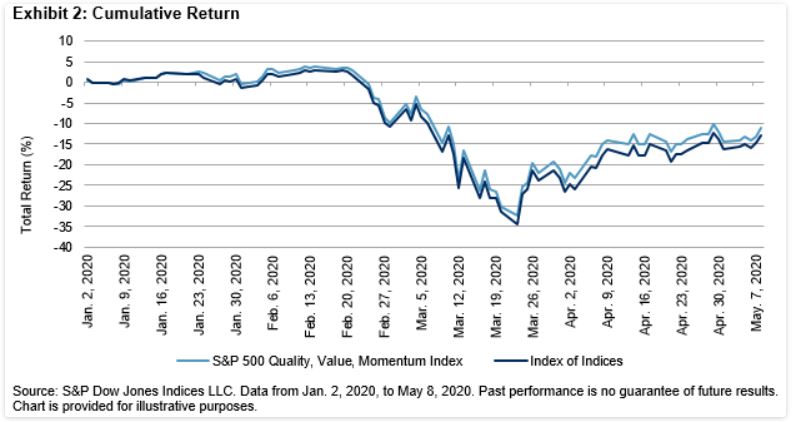
During the recent market sell-off, most of the factor indices declined until they reached a bottom in late March, before rebounding partially over the following month. Exhibit 1 shows the performance of single-factor indices and the two multi-factor combinations. While the S&P 500 QVM Multi-Factor Index’s outperformance over the IOI approach was not massive, it still did provide about 60 bps of excess return in both declining and rising phases of the market.


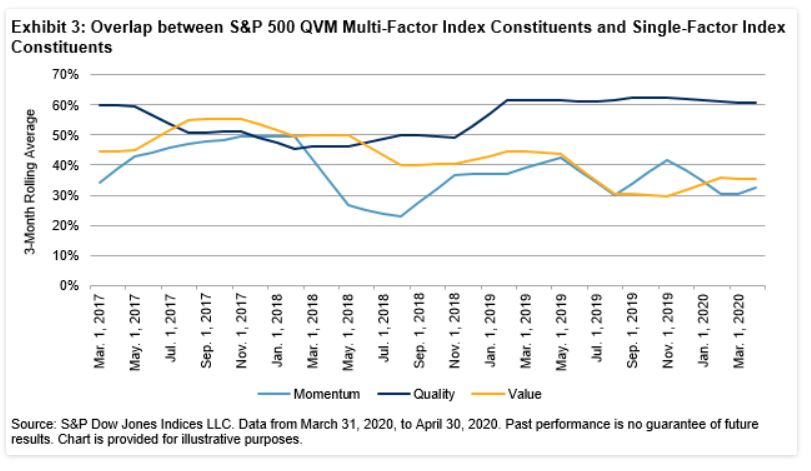
In order to see if there is any compositional bias that leads to this outperformance, we examine the overlap between the S&P 500 QVM Multi-Factor Index constituents and the individual factor index constituents. We quantify this overlap as the percentage of index weights held in common [3].

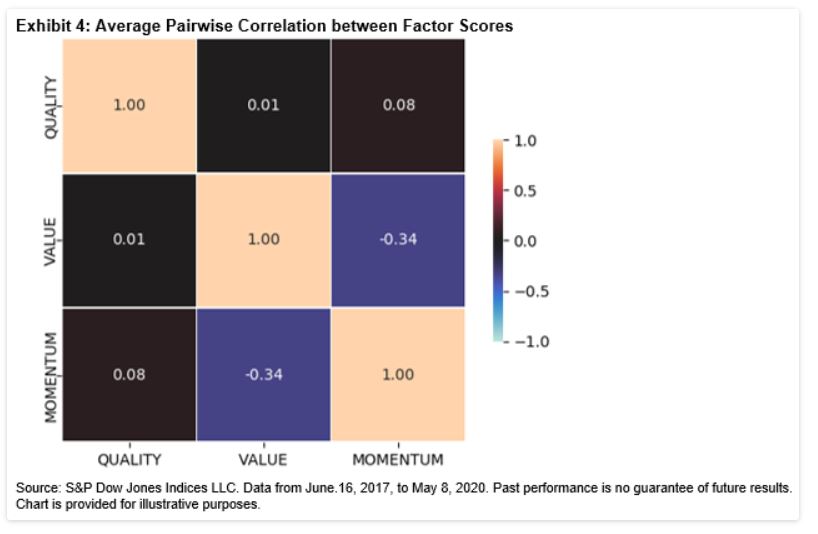
Exhibit 3 shows that the S&P 500 QVM Multi-Factor Index tends to have a higher overlap with the quality factor (which has outperformed recently [4]), and a lower overlap with the value and momentum indices. This is partly due to a negative correlation between momentum and value exposures among S&P 500 constituents (see Exhibit 4), which implies that high-quality stocks have a better chance of being selected when constituents are sorted on an average of all three factor scores.

Combining factors in a top-down manner tends to dilute individual factor loadings, since stocks that have a strong positive score on one factor might have a large negative score on another [5].
By picking overall winners across all factors, the S&P 500 QVM Multi-Factor Index held up relatively better than the top-down (IOI) approach during the recent market turmoil. Though the examined time period is relatively short and the excess performance is small, the potential benefits of bottom-up selection still shined through.
[1] https://spdji.com/indices/strategy/sp-500-quality-value-momentum-multi-factor-index
[2] “The Merits and Methods of Multi-Factor Investing” available at https://spdji.com/indexology/factors/the-merits-and-methods-of-multi-factor-investing
[3] Factor dashboard for April 2020, available at https://spdji.com/indexology/factors/get-the-latest-us-factor-returns
[5] https://www.blackrock.com/institutions/en-axj/insights/factor-perspectives/multi-factor-strategies
Content Type
Theme
Location
Language