S&P Global Offerings
Featured Topics
Featured Products
Events
S&P Global Offerings
Featured Topics
Featured Products
Events
S&P Global Offerings
Featured Topics
Featured Products
Events
Featured Products
Ratings & Benchmarks
By Topic
Market Insights
About S&P Global
Corporate Responsibility
Culture & Engagement
Investor Relations
Featured Products
Ratings & Benchmarks
By Topic
Market Insights
About S&P Global
Corporate Responsibility
Culture & Engagement
Investor Relations
S&P Global Offerings
Featured Topics
Featured Products
Events
Language
S&P Dow Jones Indices — 1 Jun, 2020
Launched in 1995, the S&P Composite 1500(opens in a new tab) (hereafter the “S&P 1500”) serves as a benchmark indicator for U.S. equity market performance, aggregating price movements of S&P 500®(opens in a new tab) , S&P MidCap 400®(opens in a new tab) , and S&P SmallCap 600®(opens in a new tab) constituents to deduce common return drivers. The S&P 1500 also increasingly serves as a basis for constructing portfolios designed to deliver a “market” return at lower cost than those active managers who offer to beat it. We shall examine the S&P 1500 from both perspectives, as well as examining its merits in comparison to popular alternatives. In particular, we observe that:
• The sizeable representation of U.S. companies means tracking U.S. equity market performance may be relevant to investors, globally;
• The S&P 1500 has outperformed the S&P 500, historically;
• Incorporating smaller companies in a U.S. market benchmark provides a more holistic view of the U.S. economy (see Exhibit 7); and
• Compared with other U.S. equity market indices, the S&P 1500 avoids relatively illiquid, lower priced, and lower quality stocks (see Exhibit 1).

U.S. companies represented an average of 49.47% of the S&P Global BMI(opens in a new tab)’s capitalization at each year-end between 1995 and 2019, more than five times the average weight of second-place Japan (9.39%). Given that U.S. companies also accounted for over 50% of the market capitalization in most global industries at the end of 2019, many investors may need to turn to the U.S. in order to obtain certain exposures.
The S&P 1500 is designed for investors seeking to replicate the performance of the U.S. equity market, or benchmark against a representative universe of tradable stocks. The S&P 1500 combines three widely followed indices—the S&P 500, S&P MidCap 400, and S&P SmallCap 600—in proportion to their free-float market capitalizations.1 Hence, the S&P 1500 uses the same inclusion criteria as its three component indices.

One of the main consequences of the index’s inclusion criteria is that the S&P 1500 does not necessarily represent the largest 1,500 U.S.-domiciled companies. For example, certain companies may be ineligible for inclusion because they have a recent history of negative earnings or they became public companies only in the past 12 months.
Exhibit 3 illustrates this point by showing the distribution of all U.S.- domiciled public company market capitalizations. We separated companies into two buckets: 1) S&P 1500 constituents, and 2) non-S&P 1500 constituents, ordering within each bucket by total market capitalization. The exhibit shows the cumulative proportion of the U.S. equity market represented by the S&P 1500 companies (1-1,500) and nonS&P 1500 companies (1,501 and up).

Exhibit 3 demonstrates that the S&P 1500 covers more than 90% of U.S. equity market capitalization.2 The kink in the line reflects the fact that certain large companies are ineligible for index inclusion because they do not pass at least one of the inclusion criteria. For example, Tesla does not currently meet the earnings criterion. 3
We will revisit the impact of the S&P 1500’s inclusion criteria in the following sections. For now, it suffices to say that the S&P 1500’s earnings criterion contributed to its significant positive quality exposure. Its ongoing reconstitution of stocks helped the S&P 1500 to have lower turnover than the Russell 3000, historically.
Over the past 25 years, the S&P 1500 benefited from its exposure to smaller companies. Exhibit 4 shows that the cumulative total returns for the S&P MidCap 400 and S&P SmallCap 600 were both higher than the S&P 500, which in turn helped the composite index to post higher returns than the U.S. large-cap benchmark.4


Although exposure to smaller U.S. companies helped the S&P 1500 post higher returns over longer horizons, Exhibit 5 shows that large-caps outperformed their smaller counterparts over the past decade. For example, the S&P 500 posted higher total returns, with lower volatility, than the S&P MidCap 400 and the S&P SmallCap 600 over the 1-, 3-, 5-, and 10-year horizons. Large-cap outperformance led to S&P 500 constituents representing more than 91% of the S&P 1500 at the end of 2019, an alltime high and higher even than at the height of the tech bubble in the early 2000s.
In light of the sizeable representation of large-cap stocks in the U.S. equity market, and their recent outperformance, many people may focus exclusively on U.S. large caps as a way to track the potential influence of the U.S. on the global equity market. However, such a focus ignores the potential relevance of mid- and small-cap U.S. companies.
Exhibit 6 shows that tracking the performance of smaller U.S. companies could be as useful as measuring the returns of certain countries: the total equity capitalizations of the S&P MidCap 400 and S&P SmallCap 600 were larger than those of many countries. For example, the S&P MidCap 400 and S&P SmallCap 600 would have ranked as the 5th and 14th largest country in the S&P Global BMI, respectively, if they were treated as stand-alone countries.

As a result, although smaller U.S. companies may be underrepresented in international portfolios, their performance may be just as relevant—if not more so—as the performance of a number of (typically well-represented) countries.5
Moreover, measuring the performance of smaller U.S. companies can offer perspectives on a broader set of macroeconomic drivers. For example, Exhibit 7 shows that smaller U.S. companies typically obtained a greater proportion of their revenue in the U.S., which contributed to their returns being more correlated to U.S. GDP growth, as well as to investment and consumption growth.6 Hence, incorporating smaller companies in a measure of the U.S. market provides a more holistic view of the U.S. economy.

One possible explanation for the distinct sensitivities to macroeconomic factors is the fact that the S&P MidCap 400 and the S&P SmallCap 600 have different sector exposures than the S&P 500. Exhibit 8 shows the S&P 500 sector weights (left chart) and the relative sector weights of the S&P MidCap 400 and S&P SmallCap 600 to the S&P 500 (right chart).
The mid- and small-cap indices had higher exposure to sectors that typically derive a greater proportion of their revenues from the U.S. (Real Estate and Industrials). This likely contributes to the S&P MidCap 400 and S&P SmallCap 600’s greater sensitivities to the U.S. economy.

Although incorporating smaller U.S. companies can increase diversification and offer a more comprehensive measure of the U.S. economy, some may question the effectiveness of using an index-based approach in smaller size ranges. Indeed, a common view is that active managers focusing on mid and small caps are better able to outperform their benchmarks.
However, results from our semiannual S&P Indices Versus Active (SPIVA®) Scorecards routinely challenge this idea: most of the time, the majority of active U.S. equity managers have underperformed.7 This underperformance has been particularly prominent over longer horizons, which speaks to the fact that environments conducive for success by active managers did not occur often.8
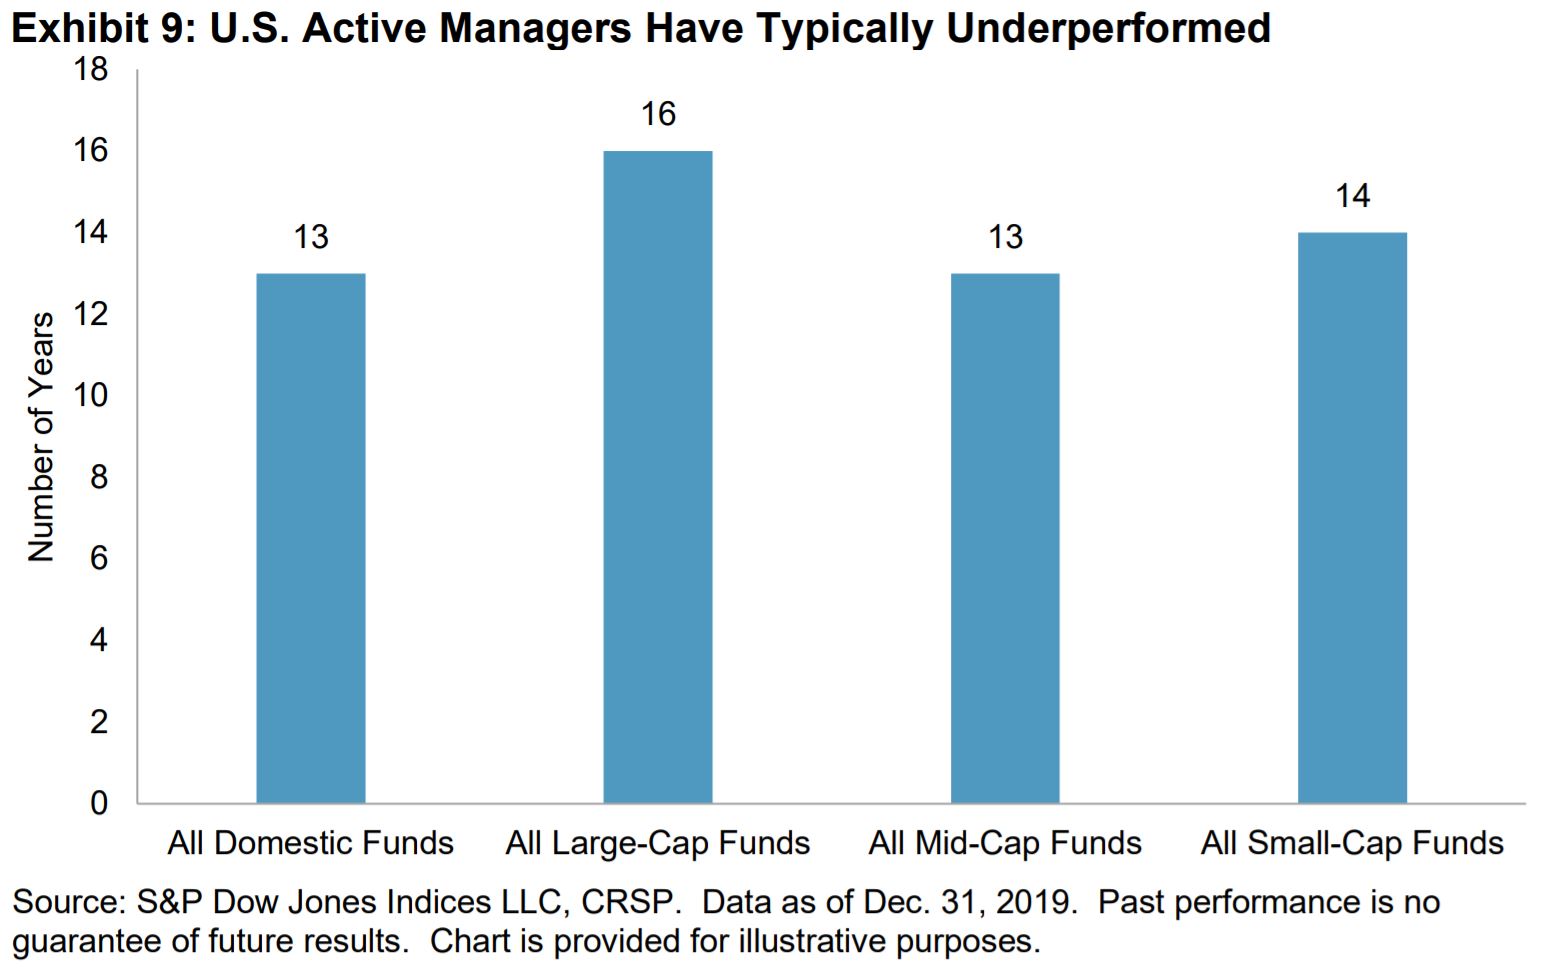
For example, Exhibit 9 shows that underperformance has been typical from most active U.S. equity managers over the past 19 years; the majority lagged the S&P 1500 in 13 calendar years since 2001. 9
Moreover, and in light of the market turbulence observed in Q1 2020, it is worth remembering that active managers found it difficult to outperform their benchmarks on a risk-adjusted basis.10 As a result, many market participants may wish to consider using an index-based approach to track U.S. equity returns.
Thus far, we have focused on S&P 1500 and some of its characteristics. However, market participants can choose from a number of indices in order to track the performance of U.S. equities. For example, the Russell 3000 index measures the performance of the 3,000 largest U.S. companies, subject to certain criteria. In this section, we compare the S&P 1500 to the Russell 3000.
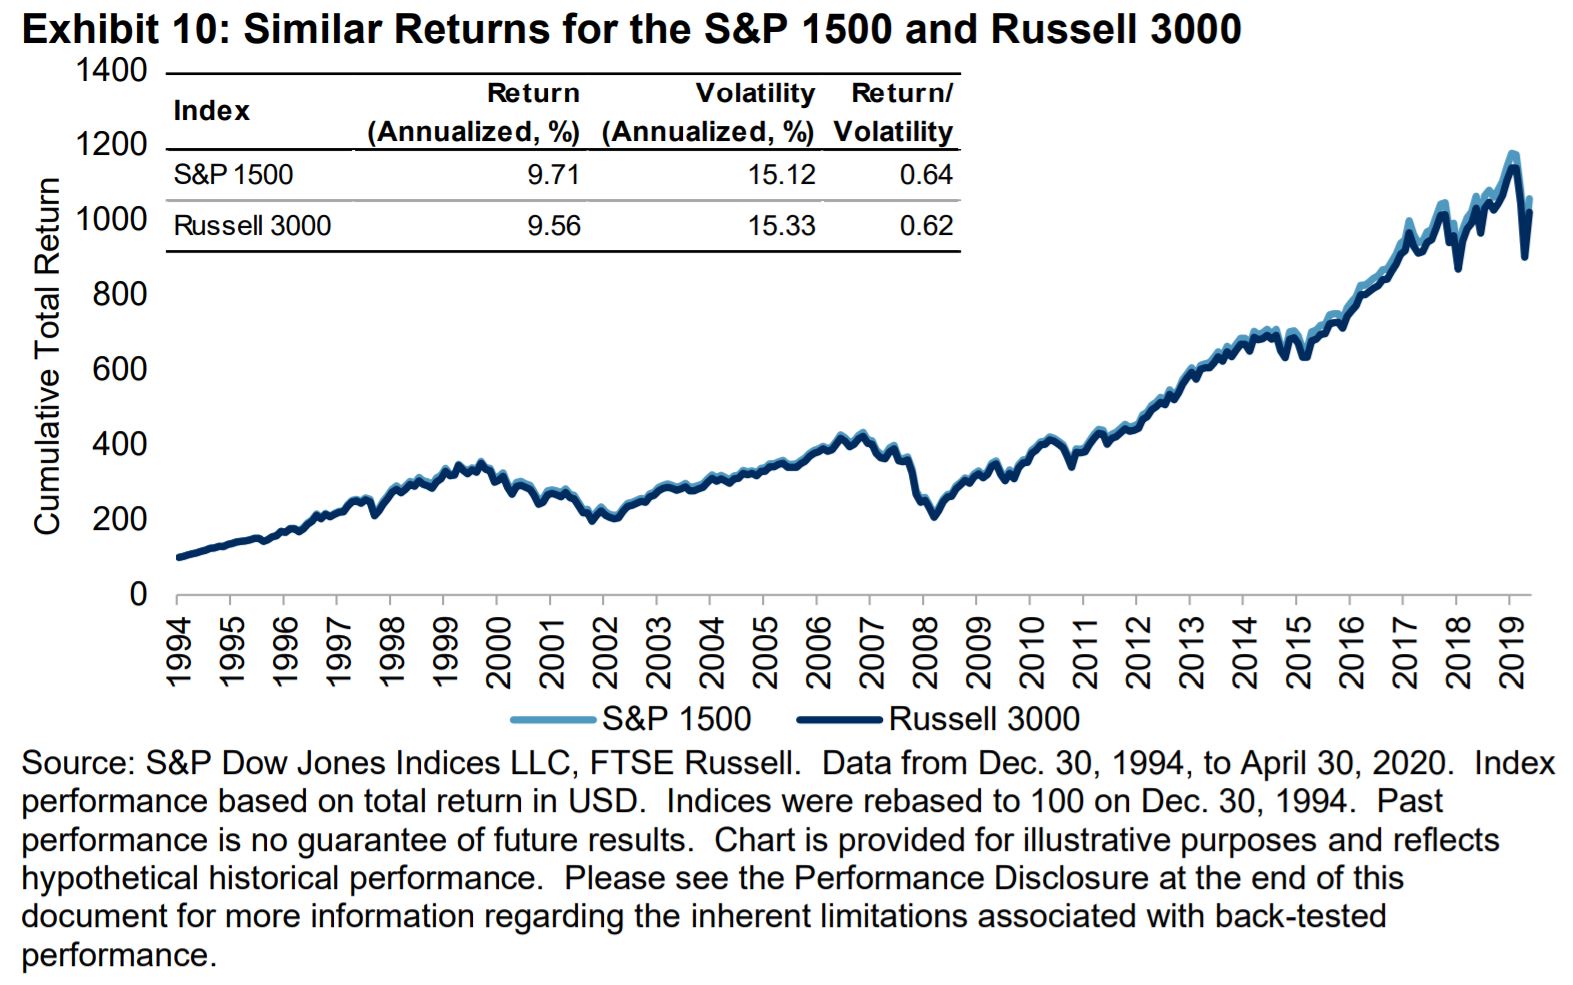
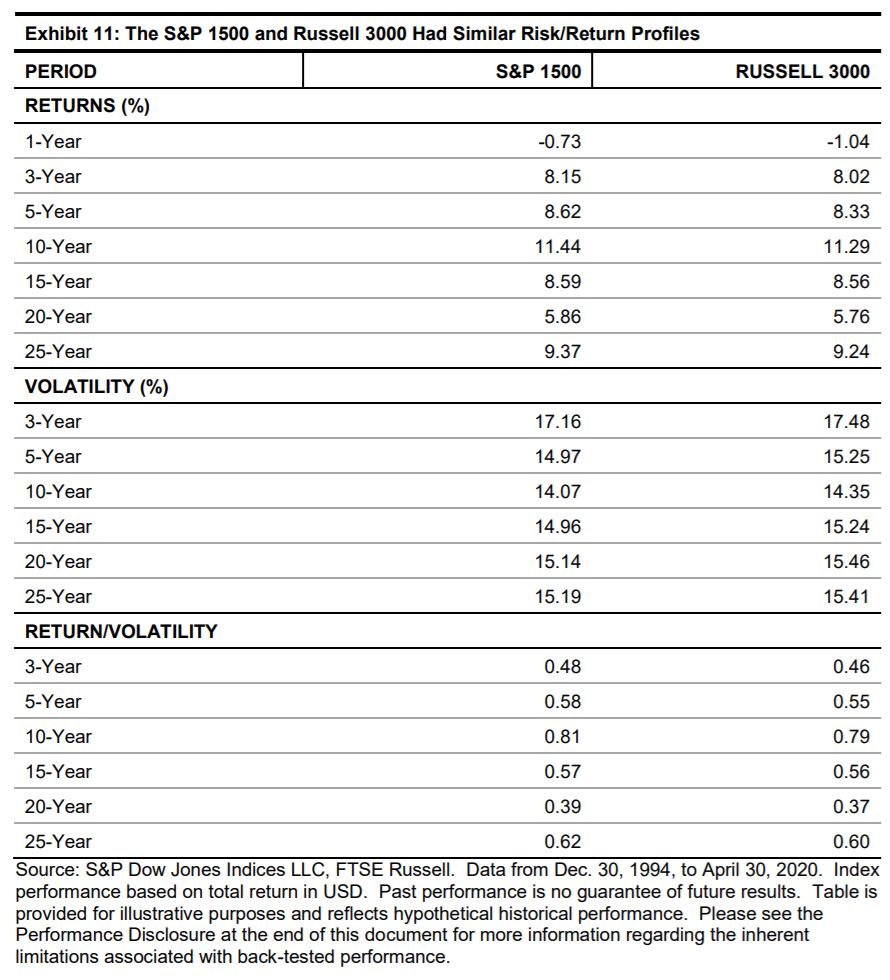
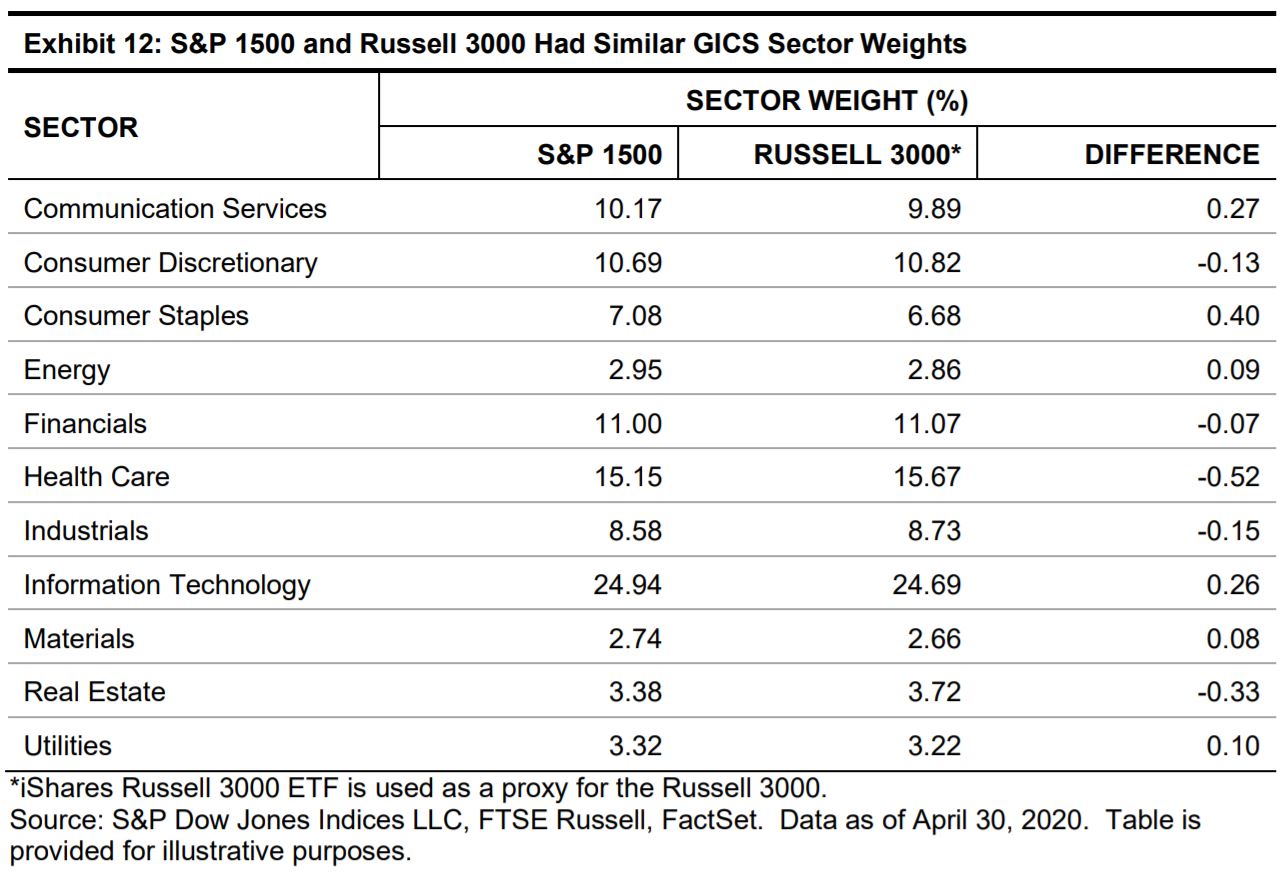
At first glance, there appeared to be little difference between the S&P 1500 and the Russell 3000. For example, Exhibits 10 and 11 show that the two indices posted similar return profiles over various horizons over the past 25 years, while Exhibit 12 shows the similarity in GICS sector weights.11
The results reflect the significant overlap in mega-cap names for both indices—the lists of the 50 largest stocks in the S&P 1500 and the Russell 3000 were identical at the end of Q1 2020, with those stocks representing approximately 50% weight in both indices. Given that these mega-cap names played a sizeable role in determining overall market returns, it is unsurprising that both benchmarks posted similar risk/return profiles.
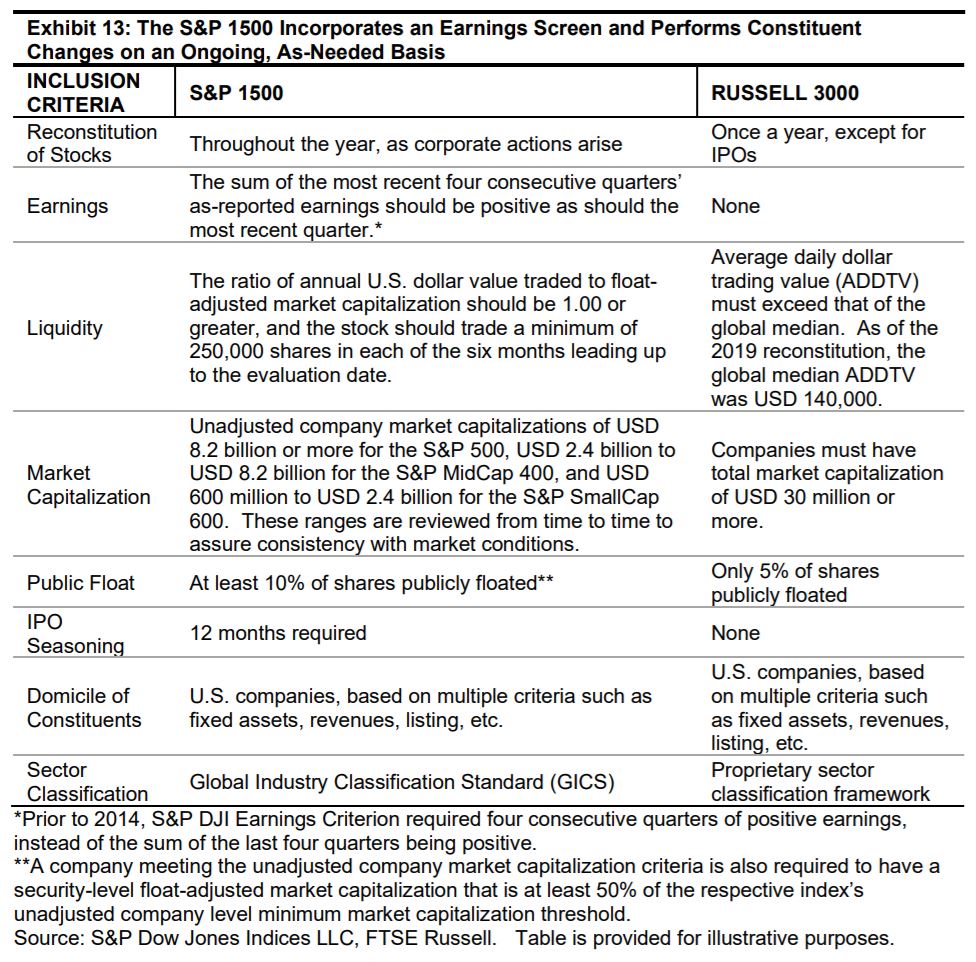
However, the similarities between the S&P 1500 and the Russell 3000 in terms of their return characteristics and sector exposures belie an important fact: the two indices are constructed differently and these differences have important consequences. Exhibit 13 provides an overview of the methodology differences between the two indices.
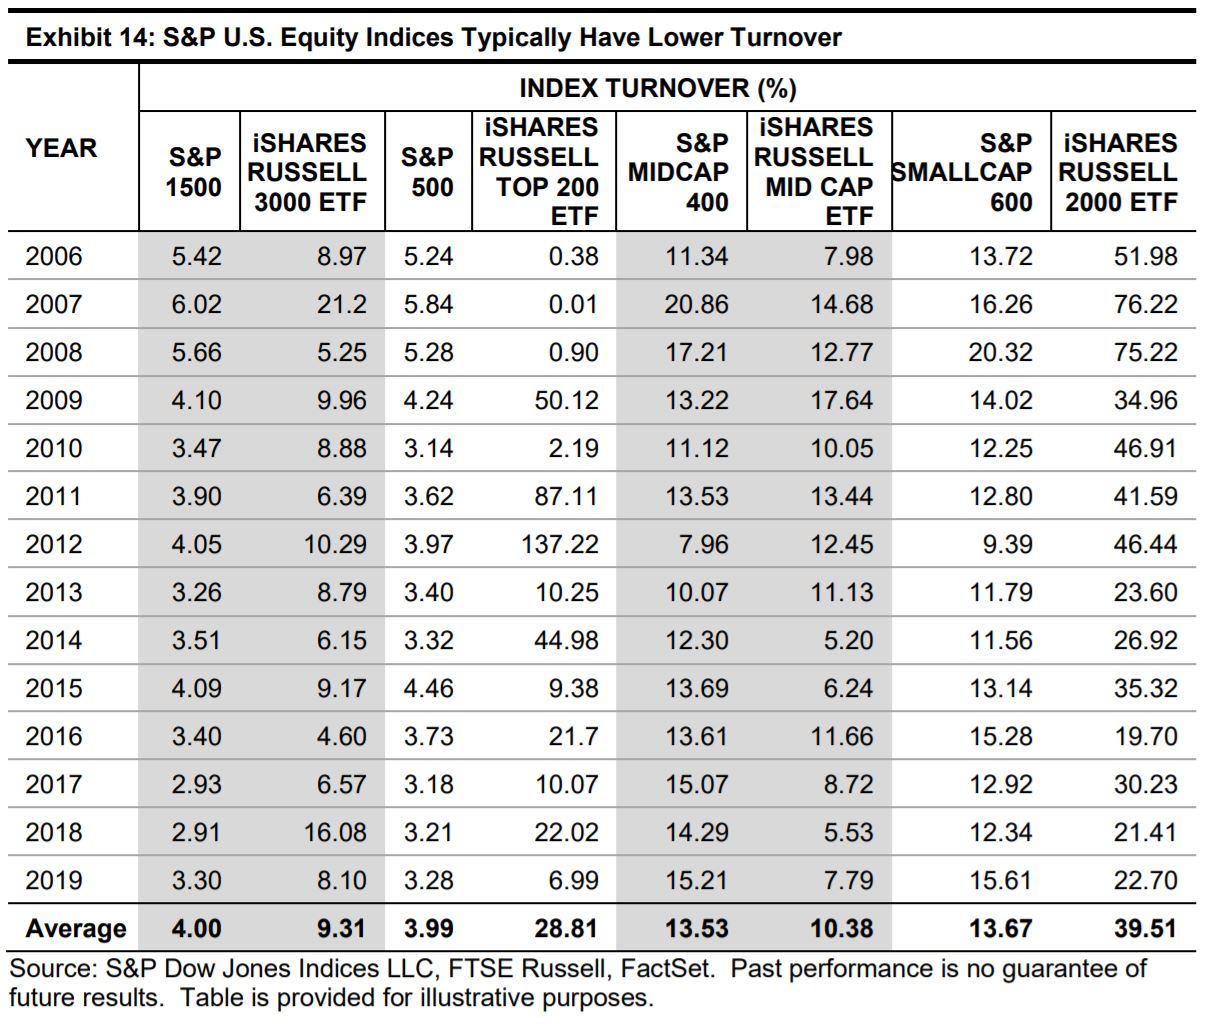
The first key difference between the S&P U.S. Equity Indices and their Russell counterparts is the frequency of their respective reconstitutions. Exhibit 14 shows that the ongoing, as-needed approach to S&P U.S. Equity Indices’ constituent changes typically resulted in lower annual turnover than their Russell counterparts, which employ an annual reconstitution in June. These results may be particularly meaningful given the potential impact of turnover figures on a portfolio’s transaction costs.12
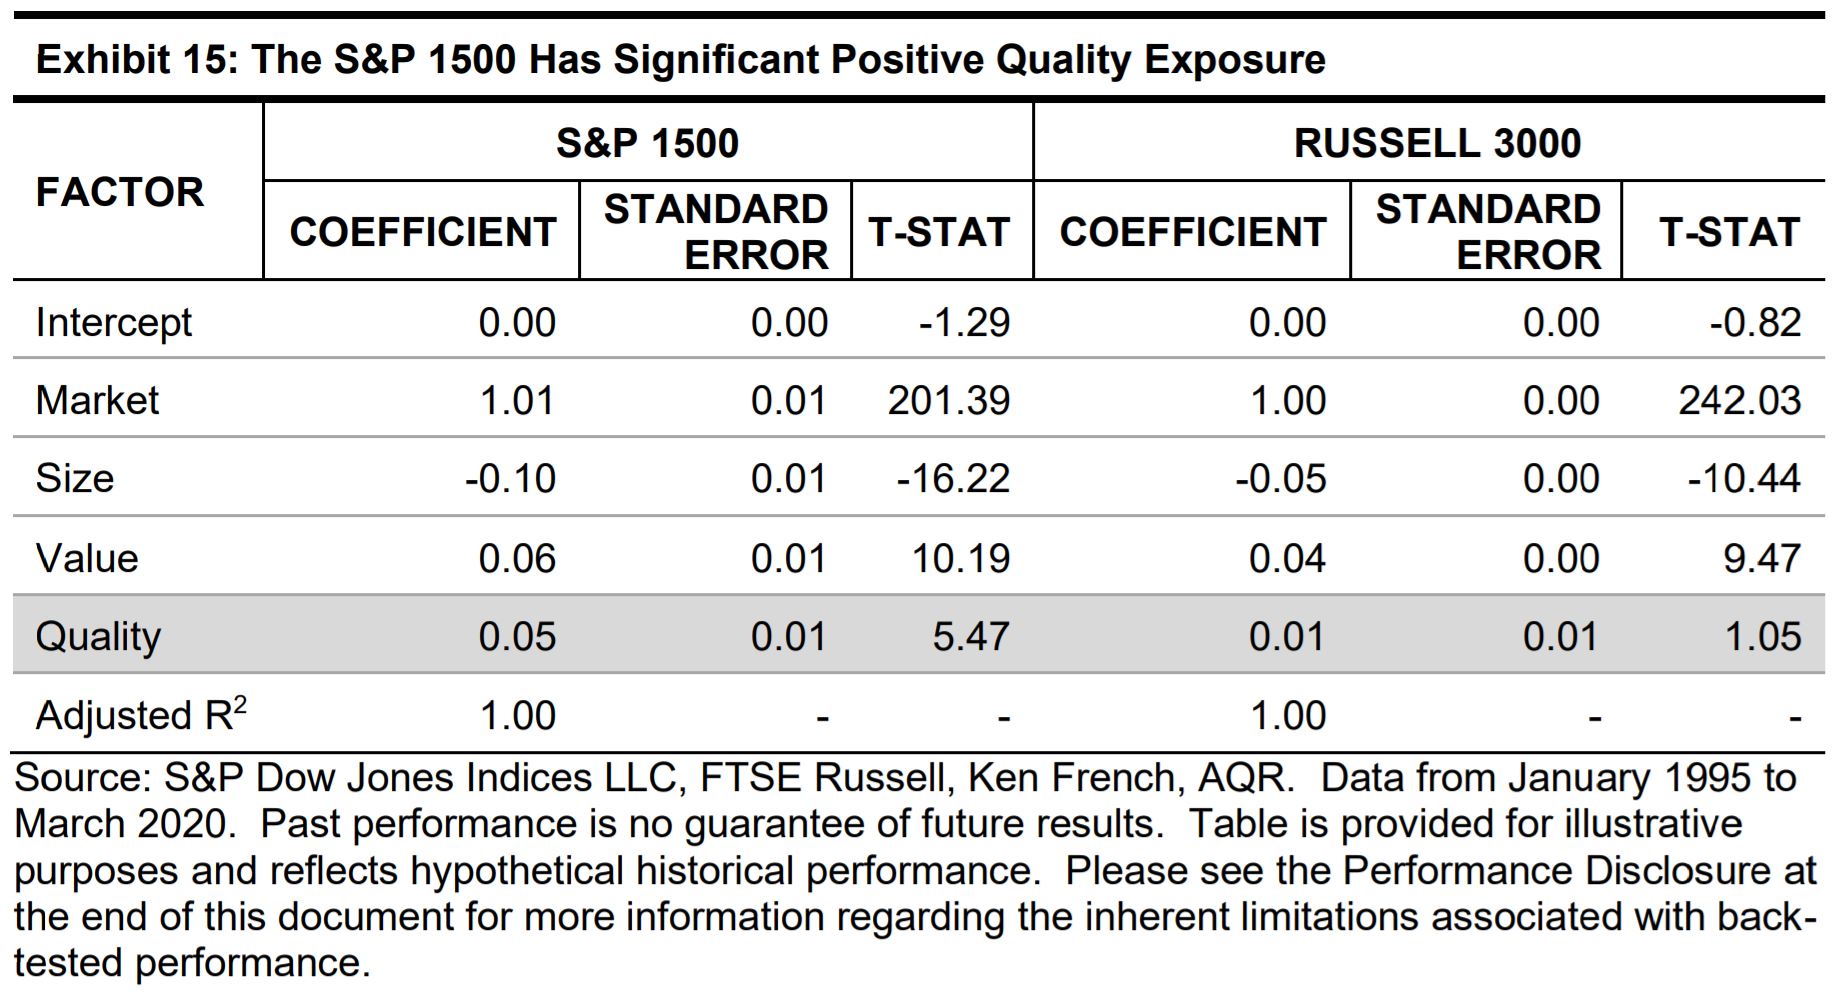
The second important difference between the two indices is that the S&P 1500 incorporates an earnings screen, whereas the Russell 3000 does not. In order to show the impact of this earnings criterion, we employ a fourfactor model that combines the traditional factors from the Fama-French Three Factor Model13 with a quality-minus-junk (QMJ) factor.14
In the model, the monthly excess returns of the S&P 1500 and Russell 3000 (independent variables) are explained using their exposures to four factors (dependent variables): sensitivity to the market (beta), size of the stocks in the index (size), average weighted book-to-market ratio (value), and quality-minus-junk (quality).
The risk premium for each factor is defined as follows.
• Equity Risk Premium: Represented by (𝑅𝑀– 𝑅𝐹), which is the return on a market-value-weighted equity index minus the return on the one-month U.S. Treasury Bill. It measures systematic risk.
• Size Premium: Represented by small minus big (𝑆𝑀𝐵), which measures the additional return from investing in small stocks. The SMB factor is computed as the average return on three small-cap portfolios minus the average return on three large-cap portfolios.
• Value Premium: Represented by high minus low (𝐻𝑀𝐿), which measures additional return from investing in value stocks, as measured by high book-to-market ratios. It is calculated as the average return on two high book-to-market portfolios minus the average return on two low book-to-market portfolios.
• Quality Premium: Represented by quality-minus-junk (𝑄𝑀𝐽), which measures the additional return from investing in quality stocks, as defined using profitability. It is calculated as the average return from two portfolios of high-quality stocks minus the average return from two portfolios of low-quality stocks.
The regression equation is then estimated as follows.
𝑅𝑖 − 𝑅𝐹 = 𝛼 + 𝐵𝑚𝑎𝑟𝑘𝑒𝑡(𝑅𝑀 −𝑅𝐹) + 𝐵𝑠𝑖𝑧𝑒(𝑆𝑀𝐵) +𝐵𝑣𝑎𝑙𝑢𝑒(𝐻𝑀𝐿)+ 𝐵𝑞𝑢𝑎𝑙𝑖𝑡𝑦(𝑄𝑀𝐽)
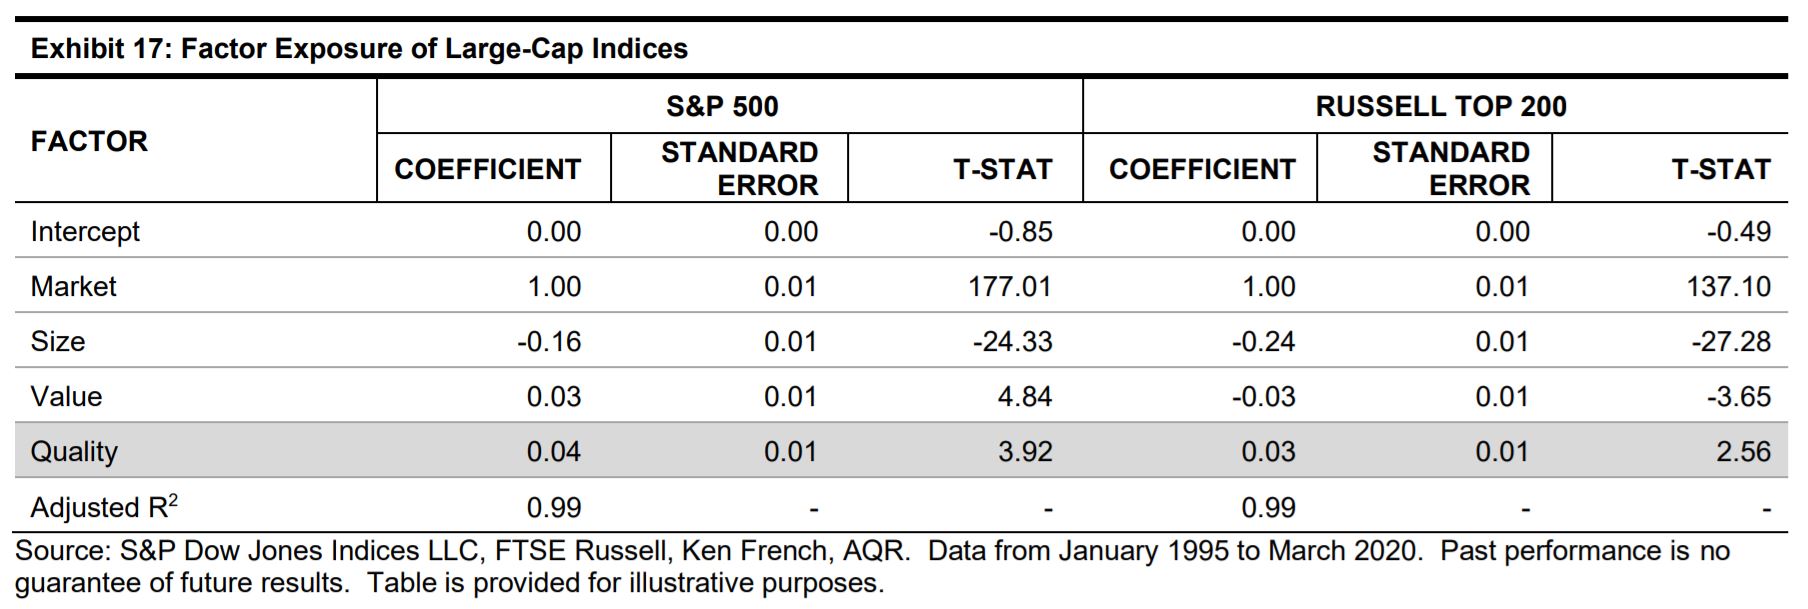
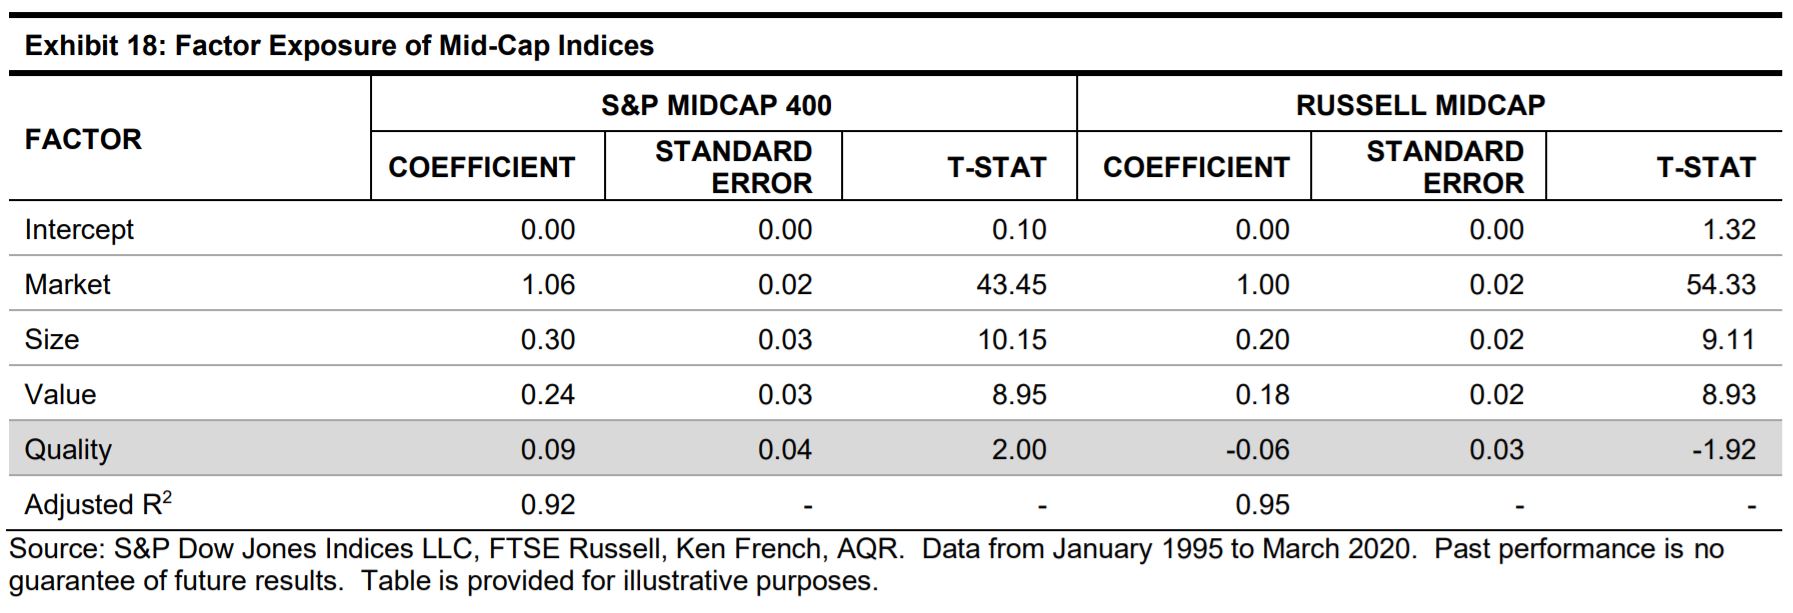
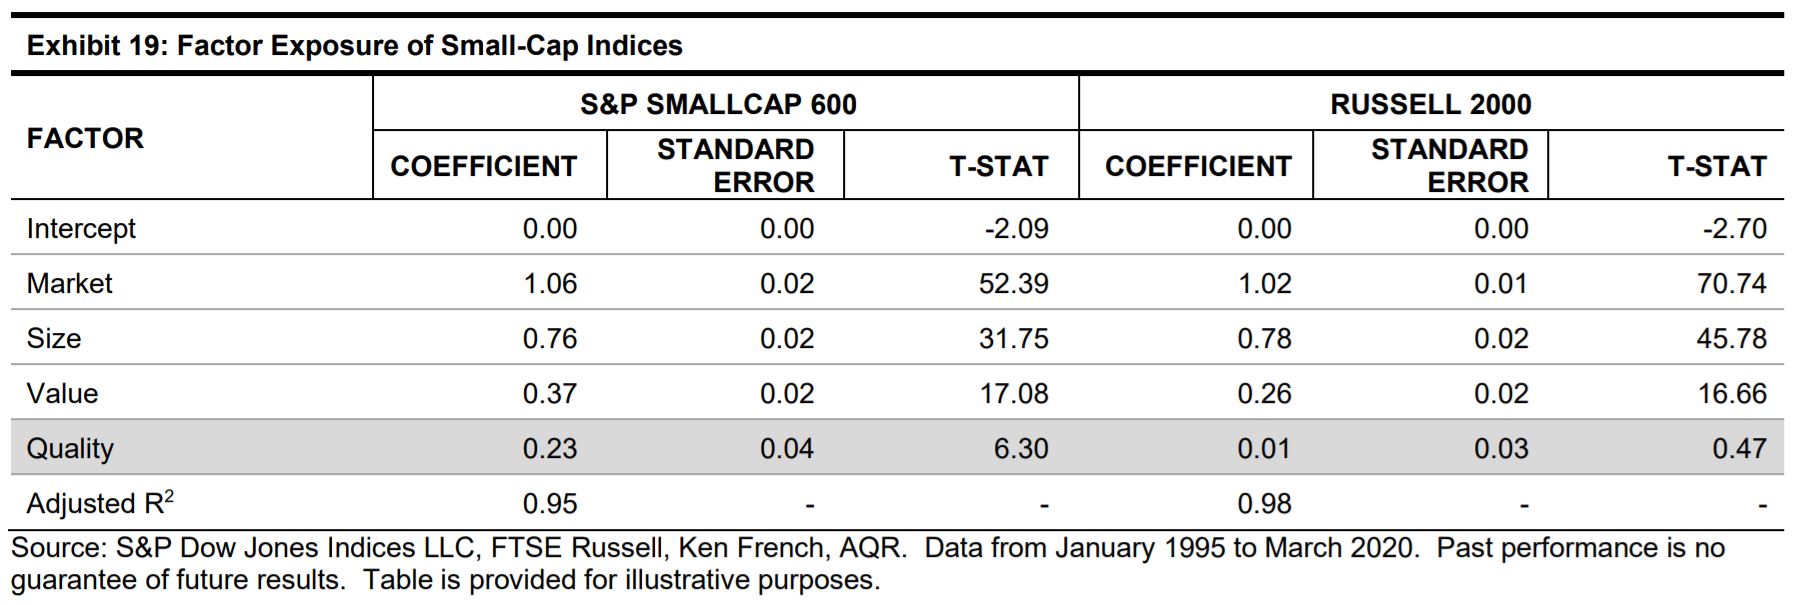
Exhibit 15 shows the results from the regression analysis covering a 25- year period. Unlike the Russell 3000, the S&P 1500 has significant, positive quality exposure, and this difference was particularly striking in mid and small caps (see Appendix). In fact, the S&P SmallCap 600’s significant, positive quality exposure helped to explain its outperformance over the Russell 2000 over the past 25 years.15
Another way to illustrate the impact of the S&P U.S. Equity Indices’ earnings criterion is to compare the characteristics of stocks in the S&P 1500 with those that are specific to the Russell 3000.
In order to make such a comparison, we first identified S&P 1500 constituents as of April 30, 2020. We also identified the largest 1,500 stocks that were not members of the S&P 1500 (“Extra 1500”), representing stocks that are specific to the Russell 3000.16 We then looked at several stock characteristics, including:
• Price, measured by the closing price on April 30, 2020;
• Liquidity, measured by the median daily value traded (MDVT) over the 12-month period ending April 30, 2020;17 and
• S&P DJI Quality score, which measures the financial stability, profitability and quality of earnings, for the S&P 1500 and “Extra 1500” stock universe.18
Exhibit 16 shows the proportion of stocks in each group—the S&P 1500 and “Extra 1500”—that have a price less than USD 10, an MDVT less than USD 1 million, and fell in the lowest quality quintile.19 The exhibit demonstrates that incorporating an earnings screen helped the S&P 1500 to avoid less liquid, lower priced, and lower quality constituents: a greater proportion of “Extra 1500” stocks were lower priced, less liquid, and of lower quality.
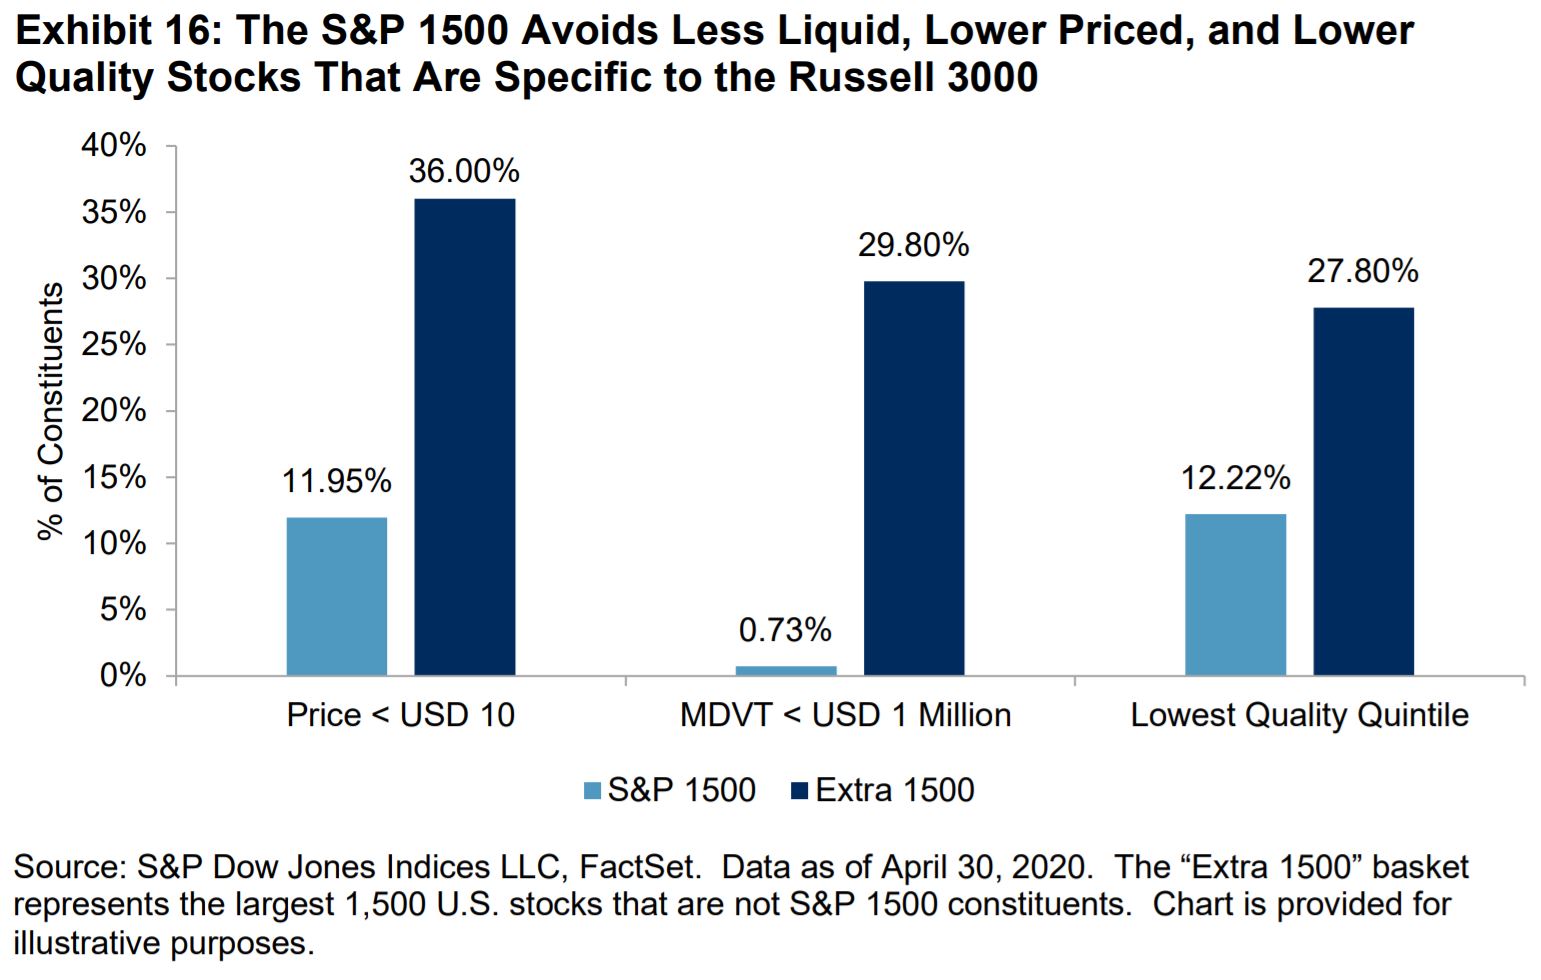
Exhibit 16 also suggests that investors may find it more difficult to trade stocks that are specific to the Russell 3000 and may be more likely to encounter capacity constraints. In other words, the S&P 1500 is a more representative benchmark for those focusing on the tradeable U.S. equity universe.
The S&P 1500 serves as a benchmark indicator for over 90% of the U.S. equity market, and incorporating smaller companies helps the S&P 1500 to offer a more comprehensive perspective on the U.S. equity market.
The S&P 1500 also offers market participants broad, efficient exposure to U.S. equities. Indeed, using the same eligibility criteria as the S&P 500, S&P MidCap 400, and the S&P SmallCap 600 contributed to the S&P 1500’s significant quality bias, and helped to explain why the S&P 1500 has lower exposure to less liquid, lower priced, and lower quality companies than the Russell 3000.
Combined with the difficulty that many active managers have had in outperforming the S&P 1500, historically, market participants may wish to consider the potential application of an S&P 1500-based approach to track U.S. equity market returns.
Content Type
Theme
Location
Language
