S&P Global Offerings
Featured Topics
Featured Products
Events
S&P Global Offerings
Featured Topics
Featured Products
Events
S&P Global Offerings
Featured Topics
Featured Products
Events
S&P Global Offerings
Featured Topics
Featured Products
Events
Language
Featured Products
Ratings & Benchmarks
By Topic
Market Insights
About S&P Global
Corporate Responsibility
Diversity, Equity, & Inclusion
Featured Products
Ratings & Benchmarks
By Topic
Market Insights
About S&P Global
Corporate Responsibility
Diversity, Equity, & Inclusion
S&P Dow Jones Indices — 10 Jul, 2020
By Jason Ye
This article is reprinted from the Indexology blog of S&P Dow Jones Indices.
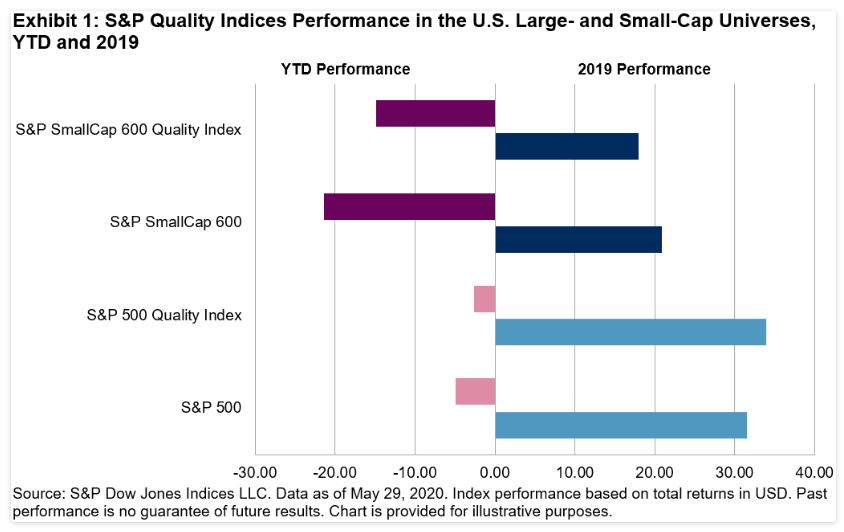
The quality factor has been outperforming the S&P 500® YTD, an accelerating trend in place since 2019.[i] In the small-cap space, however, quality underperformed the S&P SmallCap 600® in 2019 (see Exhibit 1). Despite this short-term divergence, quality has exhibited consistent premium in large caps and more profoundly in small caps throughout its history. To harvest this premium, a long investment horizon might be required.

Quality is a well-documented premium in academic literature. Its fundamental principle can trace back as early as the 1930s, when Benjamin Graham advocated buying high-quality companies with attractive valuation.[ii] From empirical work over the past decade, researchers have documented quality’s persistence throughout its history[iii] and its prevalence in the U.S. and other countries.[iv]
The S&P 500 Quality Index and S&P SmallCap 600 Quality Index seek to measure the performance of the top 20% of stocks in the S&P 500 and the S&P SmallCap 600, respectively, ranked by their quality scores (equal weighted by their return-to-equity, financial leverage, and balance sheet accrual), weighted by the product of their quality scores and market capitalizations.
Since 1995, both quality indices outperformed their benchmarks with lower volatility (see Exhibit 2).

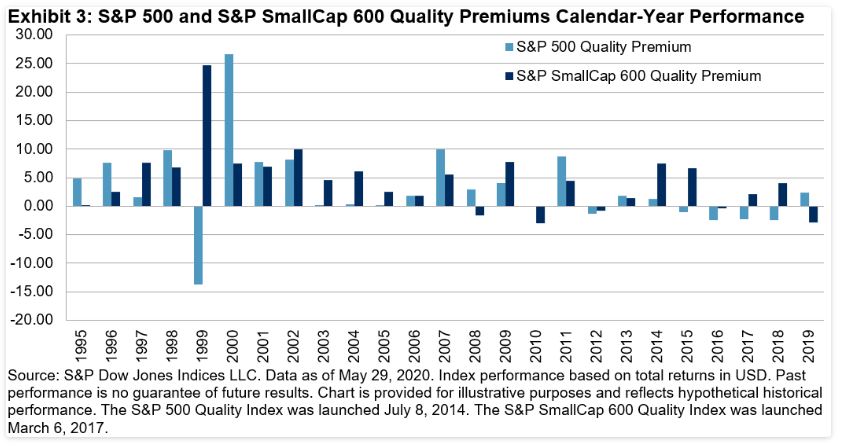
Looking at calendar-year returns, we found that the S&P 500 Quality Index outperformed the S&P 500 in 18 out of the past 25 years, with an average outperformance of 3.07% per year. Similarly, the S&P SmallCap 600 Quality Index outperformed the S&P SmallCap 600 in 20 out of the past 25 years, with an average outperformance of 4.5% per year (see Exhibit 3).

Investment horizons have had meaningful impact on the size of the quality premium. Exhibit 4 shows the rolling one-year and three-year return differences between the S&P 500 Quality Index and the S&P 500, as well as between the S&P SmallCap 600 Quality Index and the S&P SmallCap 600. We can see that the three-year rolling outperformance was higher than the one-year rolling outperformance.

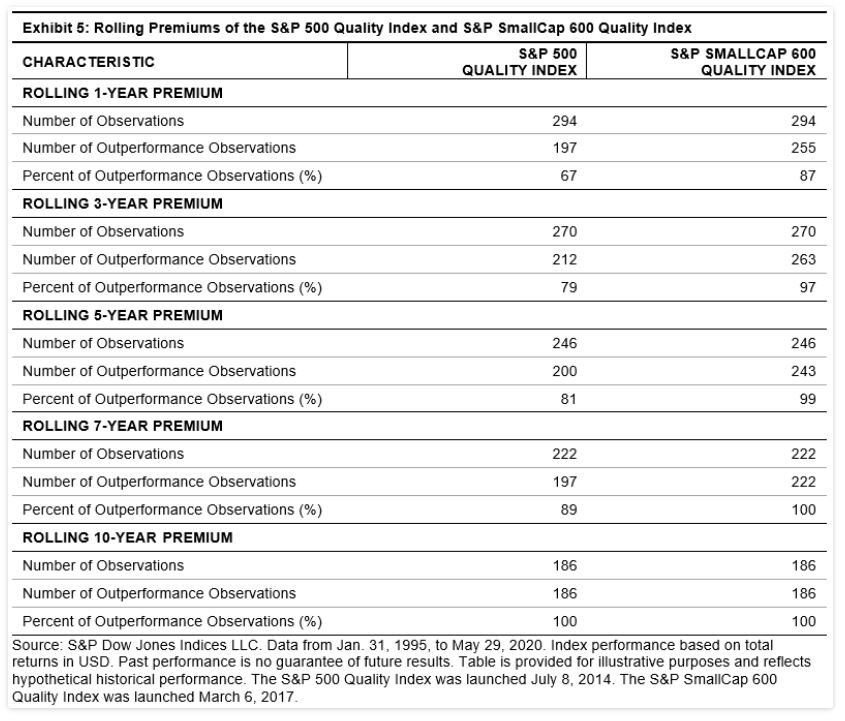
Next, we quantified the likelihood of beating the benchmark over different investment horizons (see Exhibit 5).
When the investment horizon was a period of three years, 79% of the S&P 500 Quality Index’s rolling three-year return beat the S&P 500, and 97% of the S&P SmallCap 600 Quality Index beat the S&P SmallCap 600. When the investment horizon increased to 10 years, 100% of quality indices’ rolling 10-year return beat their corresponding benchmarks. Clearly, increasing the investment horizon can improve the likelihood of capturing the quality premium and outperforming the underlying benchmark.

In summary, the quality factor has generated persistent premium in the large- and small-cap universes. To harvest the premium properly, market participants should consider a long-term investment horizon.
[i] Aye Soe. “The Quality Factor Beat the S&P 500 in 2019.” Indexology® Blog. January 2020. https://www.indexologyblog.com/2020/01/14/the-quality-factor-beat-the-sp-500-in-2019/.
[ii] Hamish Preston. “Quality: A Practitioner’s Guide?” S&P Dow Jones Indices. January 2017. https://www.spglobal.com/spdji/en/documents/education/education-quality-a-practicioners-guide.pdf.
[iii] Novy-Marx, R. 2013. The Other Side of Value: The Gross Profitability Premium. Journal of Financial Economics 108: 1-28. https://econpapers.repec.org/article/eeejfinec/v_3a108_3ay_3a2013_3ai_3a1_3ap_3a1-28.htm.
[iv] Fama, E. F. and K. R. French. 2017. International Tests of a Five-Factor Asset Pricing Model. Journal of Financial Economics 123: 441-463. https://www.sciencedirect.com/science/article/abs/pii/S0304405X1630215X.
Content Type
Segment
Language