Featured Topics
Featured Products
Events
S&P Global Offerings
Featured Topics
Featured Products
Events
S&P Global Offerings
Featured Topics
Featured Products
Events
S&P Global Offerings
Featured Topics
Featured Products
Events
Financial and Market intelligence
Fundamental & Alternative Datasets
Government & Defense
Professional Services
Banking & Capital Markets
Economy & Finance
Energy Transition & Sustainability
Technology & Innovation
Podcasts & Newsletters
Financial and Market intelligence
Fundamental & Alternative Datasets
Government & Defense
Professional Services
Banking & Capital Markets
Economy & Finance
Energy Transition & Sustainability
Technology & Innovation
Podcasts & Newsletters
Research — 1 Feb, 2024
North American wind projects experienced average wind speeds markedly below the norm in the fourth quarter of 2023, with the deviations presumably impacting capacity factors and productivity — potentially weighing on earnings for companies with asset mixes heavily exposed to the renewable.

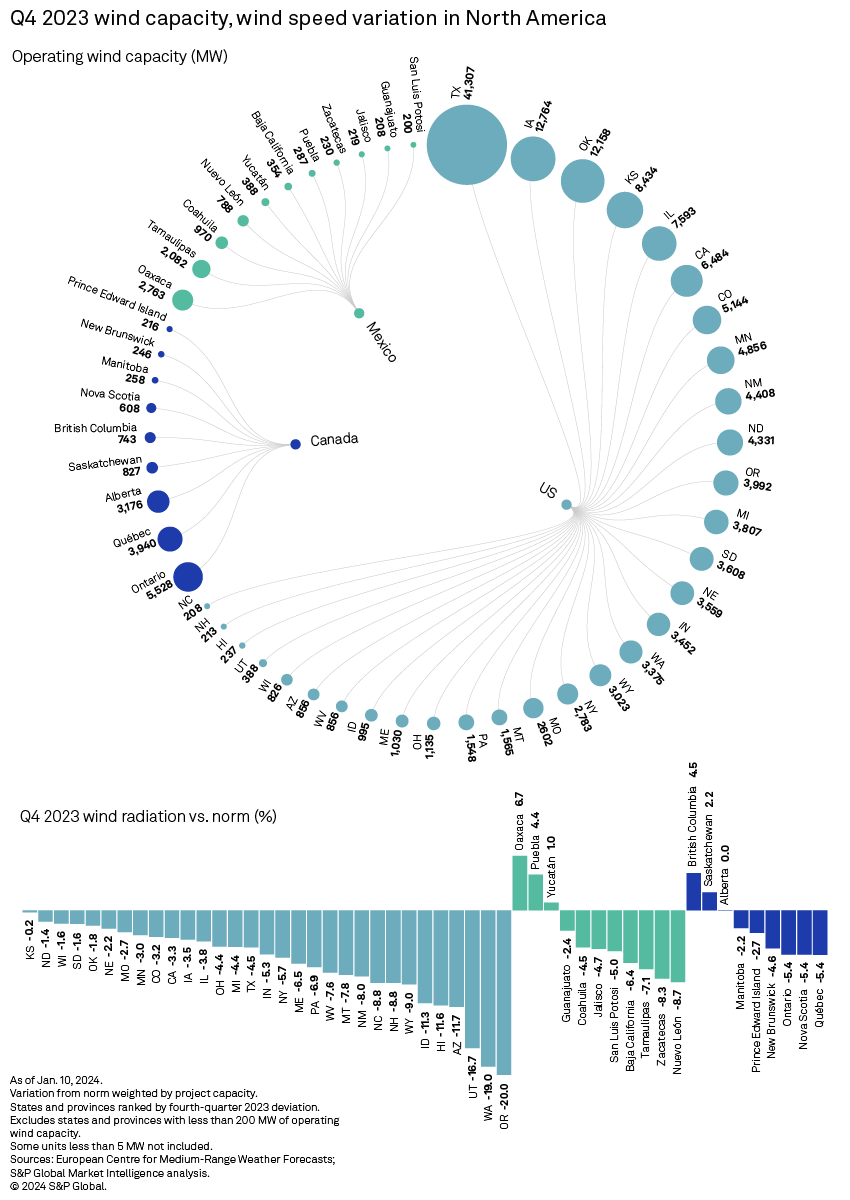
The US wind generation fleet, which accounts for 86.0% of overall North American wind capacity, continued to contend with slower-than-normal wind speeds in the fourth quarter of 2023 — this time across all wind-operating states, with the Pacific Northwest, the Desert Southwest and the northern half of the US Atlantic shore affected by particularly pronounced negative deviations.
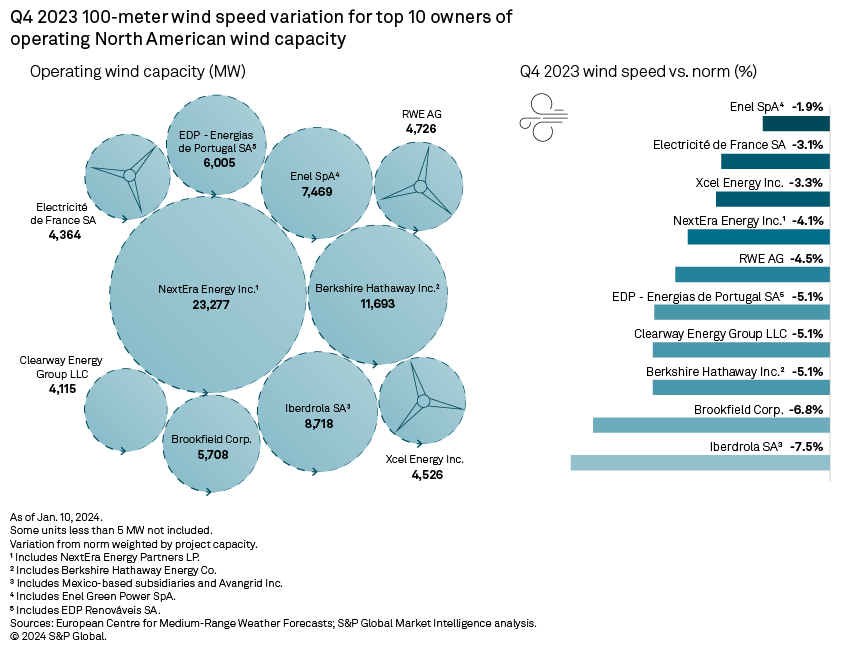
Geographic portfolio diversification was of little use in this context, with the adverse climatological conditions impacting all top owners of wind capacity, including leader NextEra Energy Inc. Overall wind energy production most likely dipped as a result and could have potential repercussions on earnings.

On average, wind speeds in North America retreated 4.1% from the 20-year trend in the three months ended Dec. 31, 2023; however, Mexico's wind generation fleet — only 5.0% of the region's total — tracked 0.1% above the norm. The US logged the largest pullback, down 4.4%, extending its streak of below-average wind speeds, as the second and third quarters of 2023 had similarly sluggish breezes. Taking a turn for the worse, all wind-operating US states ended the fourth quarter of 2023 in negative territory. Canada was more of a mixed bag. Wind speeds were 3.4% below normal in the country but were either flat or up across the provinces of Alberta, Saskatchewan and British Columbia.

In the US, the already placid Pacific Northwest, where 20-year average wind speeds hover around 4.5 meters per second (m/s), recorded the most dramatic drop. Oregon saw the metric dip 20% below normal; Washington, 19%. For perspective, in the US, only Utah, California and Nevada average slower statewide 20-year wind speeds than Oregon and Washington. With just 7.4 GW of combined wind capacity, however, the two US northwest states host only 5.0% of the US wind generation fleet.
On the other end of the spectrum, the US heartland, or states that comprise the bulk of the Midcontinent ISO, experienced relatively limited downticks. In Kansas, which ranks fourth on the US wind capacity leaderboard with 8.4 GW, wind speeds were essentially flat. In the Dakotas, Oklahoma and Wisconsin — states that operated 20.9 GW of wind capacity on aggregate in the fourth quarter of 2023 — negative deviations were less than 2%.
In Texas — home of the largest state-level US wind park, with more than 41 GW of wind capacity, or 27.8% of the US total — wind speeds receded 4.5% during the period under analysis, despite a good start. Wind projects in the state were powered by wind speeds 1.9% above average in October 2023 before reeling from negative fluctuations of 10.6% in November 2023 and 4.5% in December 2023. Texas wind speeds have averaged 7.1 m/s in the past 20 years.

Texas winds reverberate particularly heavily through the performance of US wind portfolio leader NextEra Energy Inc., as the company operates more than 28% of its wind assets in the state. All NextEra Texas-based wind projects operated under suboptimal wind conditions in the fourth quarter of 2023, including the 1,027-MW Great Prairie Wind Project — the largest existing US wind farm — with winds 4% slower than normal. The 249.7-MW Javelina Wind CISD project experienced the largest negative deviation across the company's Texas-based wind assets, with fourth-quarter 2023 wind speeds 9.6% lower than normal.
NextEra experienced a 4.1% portfolio average wind speed deficit — the seventh-largest retreat among the top 10 holders of North American wind capacity. In a third-quarter 2023 investor presentation on Oct. 24, 2023, NextEra Energy Inc. reported that a 1% change in its wind production index approximately would correspond to a $0.00-$0.01 of earnings per share for the remainder of 2023. In the same document, subsidiary NextEra Energy Partners associated a 1% change in its wind production index with $4 million to $6 million of adjusted EBITDA for the balance of 2023.
All top 10 owners of North American wind faced slower wind speeds. Iberdrola SA, which owns an 8.7-GW wind generation fleet, registered the largest decline, down 7.5%. Sixty-three of Iberdrola's 71 North American wind projects in the fourth quarter experienced ebbing wind speeds during the period, with the pullbacks from the norm ranging from 2.1% at the company's 120-MW Barton Chapel Wind project to 24.0% at 199-MW Big Horn and 50-MW Big Horn 2 Wind Project. Overall, 14 Iberdrola wind farms experienced double-digit negative deviations in the three months ended Dec. 31, 2023.

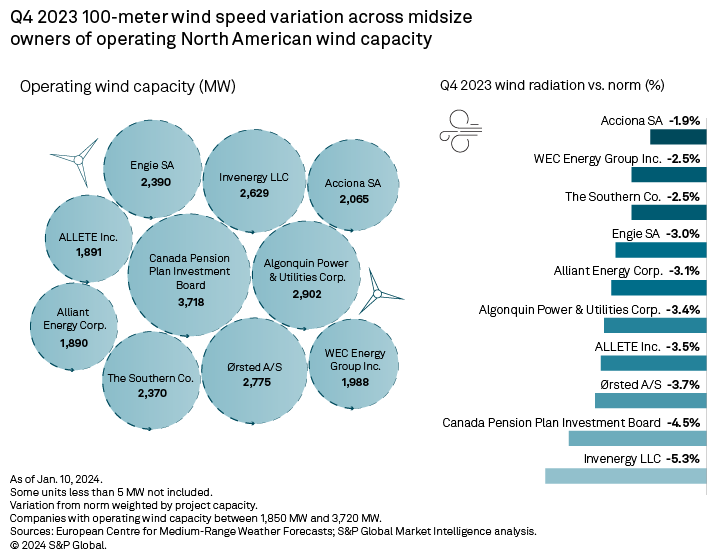
The picture is not any rosier among companies holding between 1,850 MW and 3,720 MW of North American wind capacity. All of them dealt with substandard wind conditions, with portfolio-wide drops starting at 1.9% for Acciona SA and bottoming out at 5.3% for Invenergy LLC. Invenergy's largest wind farm, the 250-MW Southern Hills Wind Project in Iowa, notably operated under average wind speeds 5% below normal during the quarter.
That said, Invenergy's Willow Creek Wind Project, Wolverine Creek Wind and Vantage Wind Power Project — respectively located in Oregon, Idaho and Washington — logged the company's largest wind speed departures from 20-year averages during the period, with drops ranging from 16.7% to 19.6%.
The 90-MW Vantage Wind Power Project has 15-year power purchase agreements with Pacific Gas and Electric Co. and Puget Sound Energy Inc. that end in 2025 and 2040, respectively. The project has an around-the-clock, fixed monthly energy transaction rate averaging $113.43/MWh, according to third-quarter 2023 S&P Global Market Intelligence quarterly transaction data.
The wind speed 100 meters above the ground is measured from the fifth-generation European Centre for Medium-Range Weather Forecasts reanalysis. The data is available at quarter-degree latitudes and longitudes, a spacing of slightly over 27.5 km. This analysis compares fourth-quarter 2023 wind speed values with the 20-year wind speed average for the corresponding period.
Data visualization by Allen Villanueva.
For wholesale prices and supply and demand projections, see the S&P Global Market Intelligence Power Forecast.
Regulatory Research Associates is a group within S&P Global Commodity Insights.
S&P Global Commodity Insights produces content for distribution on S&P Capital IQ Pro.
Tanya Peevey and Monesa Carpon contributed to this article.
This article was published by S&P Global Market Intelligence and not by S&P Global Ratings, which is a separately managed division of S&P Global.