S&P Global Offerings
Featured Topics
Featured Products
Events
S&P Global Offerings
Featured Topics
Featured Products
Events
S&P Global Offerings
Featured Topics
Featured Products
Events
Banking & Capital Markets
Economy & Finance
Energy Transition & Sustainability
Technology & Innovation
Podcasts & Newsletters
Banking & Capital Markets
Economy & Finance
Energy Transition & Sustainability
Technology & Innovation
Podcasts & Newsletters
S&P Global Offerings
Featured Topics
Featured Products
Events
Research — 16 Aug, 2024

By Steve Piper
US domestic coal prices were mixed in July, with western coal moving higher and eastern coal falling sharply. High steam coal inventories are likely to maintain pressure on coal markets through the summer months despite growth in natural gas prices. In the longer term, the US coal market is forecast to come under increasing pressure over the next 10 years from the expansion of zero-carbon electricity incentivized by the Inflation Reduction Act. In aggregate, the S&P Global Market Intelligence Power Forecast projects 42.6 GW of coal plant retirements by 2035, while 718.9 GW of renewable capacity is forecast to come online. The reduced level of retiring coal compared to prior forecasts reflects a recent turn toward retaining reliable and diverse capacity in markets that burn coal. Coal plants are still forecast for dramatically reduced generation; however, as Market Intelligence projects, US electricity demand for coal will decline 56.5% by 2035, and generation from coal plants will account for just 6.4% of electricity generation.

Coal shipments remain weak year-over-year through July, with high inventories likely to further constrain summer coal demand. Considering high inventories and competitive natural gas prices, we forecast 2024 production at 499 million short tons (MMst), 73 MMst lower than in 2023. We forecast that the rapid growth of renewable generation, spurred by the Inflation Reduction Act of 2022, will reduce coal plant capacity by 42.6 GW between now and 2035 and cut overall US coal generation 56.5%. The forecast of retirements represents a moderation compared to previous forecasts, as eastern power markets retain more coal plants for resource adequacy and generation diversity.

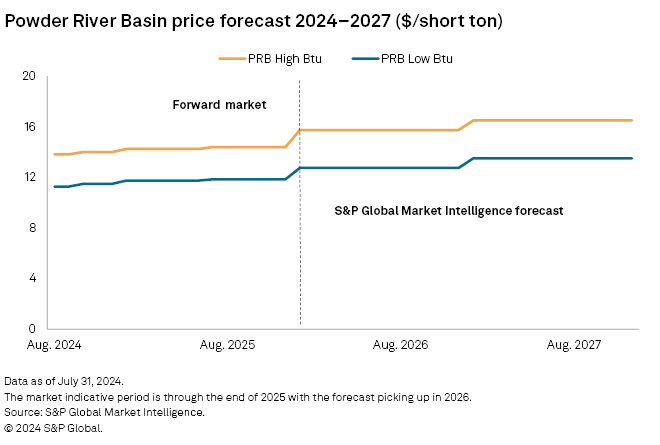
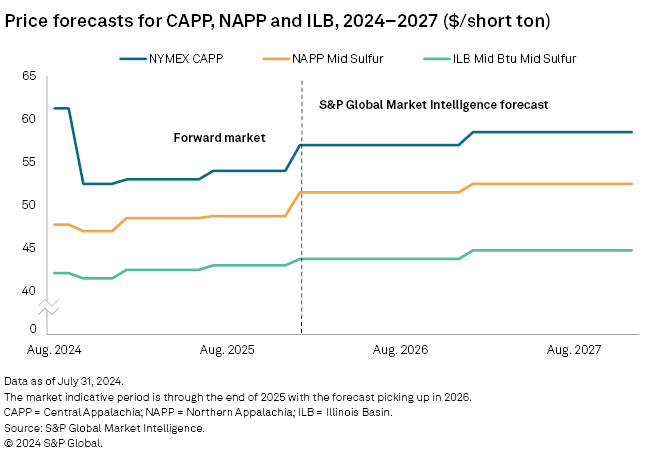
Domestic coal markets were mixed during July as the export coal rally abruptly reversed. Export benchmarks from the CAPP region shed $7.35/short ton or 9.0% to $74.50/short ton. NYMEX CAPP reset sharply lower at $52.50/short ton, down 27.1%. NAPP Pittsburgh Seam 13,000 Btu per pound lost $11.00/short ton, or 19.0%, to $47.00/short ton, while Illinois Basin 11,500 mid-sulfur fell $1.50/short ton to $41.50/short ton. Against the broader trend of price declines, the NYMEX Powder River Basin benchmark gained 45 cents/short ton to $14.00/short ton, a 3.3% gain.
After rallying in June on a hot start to summer, natural gas prices eased in July in part due to outages at LNG export facilities in Texas from Tropical Storm Beryl. The outages stranded excess natural gas volumes in the domestic market. Henry Hub spot gas opened at $2.42/MMBtu and fell to a mid-month low of $1.88/MMBtu before closing at $1.90/MMBtu. Inventories built during the month to 3,249 BCF as of July 26, 441 BCF higher than the five-year average, and 252 BCF above 2023 levels.
Regional gas markets followed Henry Hub downward except in the West. Chicago Gate natural gas averaged a $0.31/MMBtu discount to Henry Hub at $1.80/MMBtu, while TCO Pool was discounted $0.45/MMBtu at $1.65/MMBtu. TETCO M3 was discounted $0.56/MMBtu below Henry Hub at $1.55/MMBtu. SoCal Border moved to a premium of $0.21/MMBtu for an average monthly spot price of $2.32/MMBtu. These gas price levels support gas generation versus coal through the summer months, contributing to lagging coal prices.
The US Energy Information Administration estimated April 2024 coal stockpiles at 137 MMst, 3 MMst higher than in March. This again tests new maximum inventory levels for the coal fleet as it stands today.

Current flat forward pricing for PRB coal reflects both discounts needed to compete against natural gas and above-normal stockpiles. Declining coal demand and this year's inventory overhang will restrain price growth in the medium term. In the Western US, natural gas prices remain high enough to accommodate the appreciation of PRB and other Western US coal prices, but there is relatively little headroom for demand growth.
Bituminous coal price levels are mainly driven by export markets, which renders bituminous domestic coal generation uncompetitive against natural gas. With eastern natural gas prices expected to remain low at least through the fall of 2024, coal-to-gas switching will substantially limit coal demand. Export coal markets, meanwhile, are forecast to remain essentially flat for 2024.

Pricing benchmarks exceeding $65/short ton indicate sustainable returns on bituminous coal, with recent price weakness in some export benchmarks indicating an oversold market even as higher-quality benchmarks retain premiums. After holding firm last year, bituminous coal demand for electric generation is forecast to fall in 2024 due to competitive natural gas and higher coal inventories. This will tend to restrain prices at least through 2025. Overall, Eastern coal demand is forecast to decline 97 MMst from 2023-2030, as both steam and metallurgical demand decline from current levels.
Outlook for US coal production, demand
For the four weeks ending July 20, coal shipments averaged just 9.2 MMst, 15.6% below this time last year. High coal inventories and competitive natural gas prices continue suppressing shipments into the summer months.
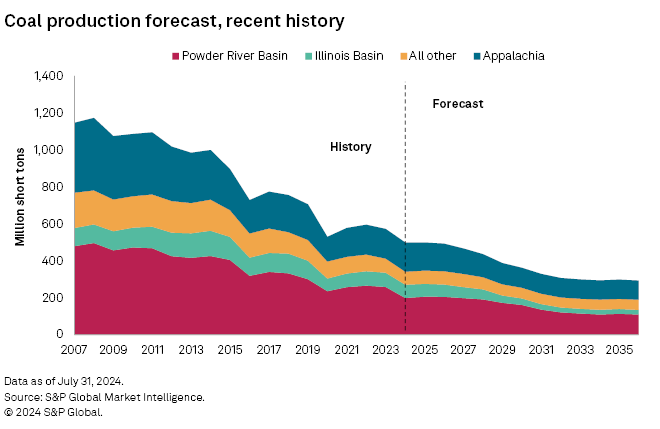
The chart below compares the current production forecast with recent history. Electric sector coal demand is expected to fall 5.6% year over year, but coal production must ramp down to a greater extent to clear surplus inventories. This will constrain coal production to a forecast 499 MMst, a decline of 73 MMst from 2023 levels. The overall coal market, that is, domestic demand and exports, is forecast to decline by 174 MMst between 2023 and 2030.
Production outlook — Powder River Basin
Preliminary second-quarter 2024 production reports of the US Mine Safety and Health Administration (MSHA) indicate year-to-date production at 97.1 MMst, an annualized rate of 194.2 MMst. High inventory levels observed through April will pressure demand throughout 2024, with production now forecast at 199 MMst. After 2025, Commodity Insights projects that coal generation retirements in the Midwest and a substantial expansion of wind generation in Powder River Basin's core markets will shrink coal demand to 161 MMst through 2030. Coal plant utilization is forecast to continue declining, driving production down to 113 MMst through 2035.
Production outlook — Illinois Basin
Preliminary MSHA reports for the second quarter of 2024 indicate 36.2 MMst of production year-to-date, an annualized rate of 72.4 MMst. We forecast additional displacement throughout the year will bring annual production down to 72 MMst. The expansion of wind generation incentivized by the Inflation Reduction Act and announced coal retirements are forecast to further erode Illinois Basin coal demand over the next several years. Coal production in the Illinois Basin is forecast to fall to 35 MMst by 2030, further declining to 26 MMst by 2035.
Production outlook — Appalachian basins
Preliminary second-quarter 2024 production reports of the MSHA indicate year-to-date production at 78.9 MMst, an annualized rate of 157.8 MMst. With export into seaborne metallurgical markets forming an increasingly larger portion of Appalachian coal demand, the region's aggregate demand is less sensitive to natural gas price competition than in domestic producing regions of the Powder River and Illinois Basins. But at today's pricing differentials to natural gas, there are coal generation volumes in the US Southeast subject to displacement. Reduced electricity demand offset by firmer exports will drive production down to a forecast 158 MMst this year. As remaining domestic demand erodes with only modest offsets from export growth, Appalachian production is forecast to fall to 108 MMst by 2030.

Further information
Market-indicative coal forecasts produced by Commodity Insights represent forward curves for spot-traded instruments analogous to a strip of contracts. The shorter tenors — current year, prompt year plus additional years if available — are driven by the observed/assessed market. The longer tenors — typically forecast years three to 20 for physically assessed markers and NYMEX futures — are driven by fundamental estimates of cash costs of production, accepted returns to capital, regional productive capacity, and forecast supply and demand. For the long-tenored portion of the curve, Commodity Insights forecasts prices for specific coal markers and defines the remaining markers via historical spreads.
Regulatory Research Associates is a group within S&P Global Commodity Insights.
S&P Global Commodity Insights produces content for distribution on S&P Capital IQ Pro.
For further details on coal prices, supply and demand, visit the S&P Coal Forecast Summary page.
This article was published by S&P Global Market Intelligence and not by S&P Global Ratings, which is a separately managed division of S&P Global.
