S&P Global Offerings
Featured Topics
Featured Products
Events
S&P Global Offerings
Featured Topics
Featured Products
Events
S&P Global Offerings
Featured Topics
Featured Products
Events
Banking & Capital Markets
Economy & Finance
Energy Transition & Sustainability
Technology & Innovation
Podcasts & Newsletters
Banking & Capital Markets
Economy & Finance
Energy Transition & Sustainability
Technology & Innovation
Podcasts & Newsletters
S&P Global Offerings
Featured Topics
Featured Products
Events
11 Feb, 2020
Highlights
While financial data tells us “how a company has done in the past,” shipping data provides a closer-to-real time indicator of “what a company is doing now.”
This new quantamental report illustrates how to find investment insights in Panjiva’s US seaborne and Mexican datasets using the US auto parts industry as a case study.
In addition to the findings, readers can access the SQL queries needed to recreate the paper’s use cases.
World merchandise trade accounted for an estimated $19.7 trillion in 2018, about 90% of which is by sea. While financial data tells us “how a company has done in the past,” shipping data provides a closer-to-real time indicator of “what a company is doing now.” Panjiva’s shipping data allows investors to track trends, identify anomalies, and assess risks for companies engaged in international trade. This paper illustrates how to find investment insights in Panjiva’s US seaborne and Mexican datasets using the US auto parts industry as a case study.
Findings include:
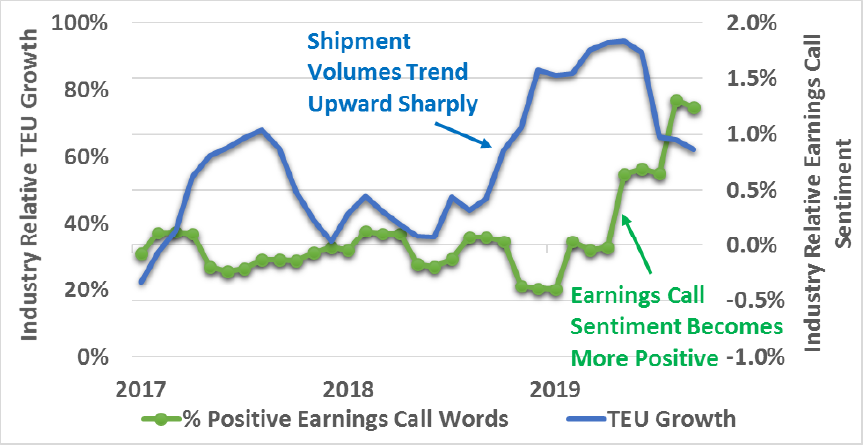
LCI Industries: Industry-Relative Import Growth vs. Earnings Call Sentiment, 2017-2019

To access the complete findings, as well as the SQL queries needed to recreate the paper’s use cases, click here(opens in a new tab).
Research
Event
Theme
Products & Offerings
