S&P Global Offerings
Featured Topics
Featured Products
Events
S&P Global Offerings
Featured Topics
Featured Products
Events
S&P Global Offerings
Featured Topics
Featured Products
Events
Banking & Capital Markets
Economy & Finance
Energy Transition & Sustainability
Technology & Innovation
Podcasts & Newsletters
Banking & Capital Markets
Economy & Finance
Energy Transition & Sustainability
Technology & Innovation
Podcasts & Newsletters
S&P Global Offerings
Featured Topics
Featured Products
Events
Research —
By Min Jiang and Anthony Yang
Highlights
Leveraging fundamental and sentiment data to assess the probability of default of companies in the Chinese domestic market
S&P Global Ratings does not contribute to or participate in the creation of credit scores generated by S&P Global Market Intelligence. Lowercase nomenclature is used to differentiate S&P Global Market Intelligence credit model scores from the credit ratings issued by S&P Global Ratings.
Overview
Thanks to advances in natural language processing (NLP) in recent years, sentiment data has been widely explored to gain information advantage in financial market. Sentiment analysis is often used to uncover signals embedded in a variety of unstructured text corpus, e.g., social media news and company announcements. As a useful complement to the traditional financial statement data, sentiment data may provide new insights on a company’s financial health in a timely manner. At S&P Global Market Intelligence, we have developed PD Sentiment China model (PDS China 1.0), where sentiment data are used as novel factors to gauge the credit risk for a corporate obligor. The model generates 1-year probability of default (PD) for public and private companies in the China market, aiming to provide early warning signals at a short-term horizon prior to credit events.
More specifically, PDS China 1.0 is built on a logistic regression framework using both company sentiment scores and PD estimates from the PD Fundamentals Model 2.0 (PDFN 2.0) China Model. [1] The final PDS model PD is adjusted to reflect the “real” or target default rate that is in line with the benchmark, which is based on the average observed default rate for companies in the Chinese domestic market. The model can be used by risk managers at financial institutions, corporations, and asset management firms to:
Model Highlight
The model is trained on the bond issuers sample in the China local market with default flags sourced from the S&P Global Market Intelligence’s China Credit Analytics Platform (CCAP). The fullowing factors are considered:
1) Baseline PDs (PDFN 2.0) that reflect the long-term financial health of companies, which are captured by such financial ratios as liquidity, leverage, profitability, efficiency and size factor, and industry risk factor.
2) Sentiment information that captures the short-term signal for a company’s financial health and its time-varying fluctuations. We include two types of data:
The PDS China 1.0 consists of three sub-models, each generating an output:
Model Features
Entity Coverage
The model applies to both publicly-traded and privately-owned companies in the China corporate sector (see Appendix for details on coverage) as defined by Primary Industry Classifications (PICs). The model is applicable for companies with necessary sentiment data. [3]
Model Outputs
The model’s primary outputs are one-year PDs and the corresponding PD-mapped credit scores. The mapping of PD to credit score is based on S&P Global Market Intelligence's global rated universe and spans a period of more than 35 years (starting from 1981).
Model Inputs
The main inputs for PDS China 1.0 are:
The final model results are generated based on exponentially weighted moving averages of sentiment scores and tag ratios.
PD Calibration
The absulute PD values from a statistical credit risk model are usually influenced by the observed default rates of the training sample. A model with good discriminatory power could also generate PD values that are either too high or too low, when compared to historical observed default rates. However, it is difficult to obtain a training dataset that perfectly represents the real world’s default frequencies, due to data availability. This may skew the model outputs to be either more aggressive or conservative, making the final adjustment of the PD level necessary. In PDS China 1.0, we refer to the European Banking Authority Risk Dashboard to calibrate the model outputs.[4]
Early Warning Signals
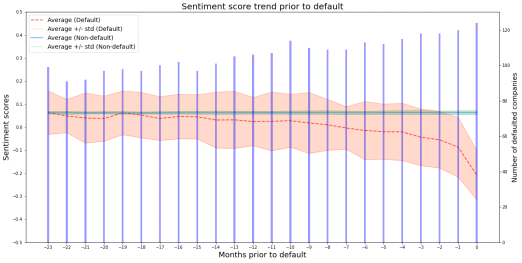
We tested how sentiment scores fluctuate at different time points prior to default for historical defaults in the China onshore bond market, and compared the trends with those for non-defaulted bond issuers. Figure 1 shows the one standard deviation band of company sentiment scores for each month prior to default. On average, sentiment scores start to deteriorate twelve months prior to default. They tend to move into the negative zone as the time gets close to default. Further, the closer to the default, the steeper the slope. The drop becomes more dramatic at two months prior to default.
Figure 1. Trend of sentiment scores prior to default events

Source: S&P Global Market Intelligence. Data as of September 2021. For illustrative purposes only.
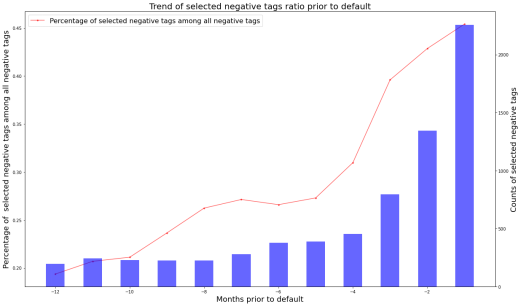
The selected tag ratio fullows the similar trend. Figure 2 shows that on average, the selected negative tag ratio increases from 0.2 at twelve months prior to default to 0.45 at one month prior to default. This deterioration becomes more striking at four months prior to default.
Figure 2. Trend of selected negative tag ratio prior to default events

Source: S&P Global Market Intelligence. Data as of September 2021. For illustrative purposes only.
Data Statistics on Training Sample
The model is trained on historical data of 4,842 bond issuers in China, including 1,648 public issuers and 3,194 private issuers. The sentiment data, including sentiment scores and news tags, spans the period from 2015 to 2021. The average number of daily sentiment scores per year is 82 for companies in the sample and 50% of companies have more than 41 daily sentiment scores per year.
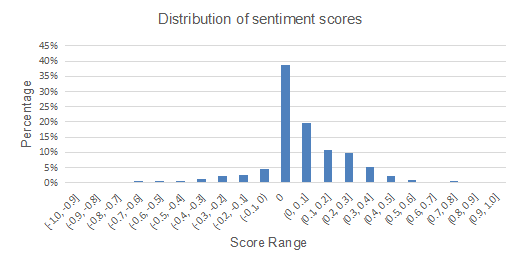
Figure 3 shows the distribution of sentiment scores for the overall sample. The majority of sentiment score are within -0.5 and 0.5.
Figure 3. Distribution of sentiment scores

Source: S&P Global Market Intelligence. Data as of September 2021. For illustrative purposes only.
Model Performance
The discriminatory power of a PD model can be measured via the Receiver Operating Characteristic (ROC) that shows the model’s ability to distinguish obligors by assigning higher (lower) PD values to companies that will likely (not) default in a specific time horizon.
The ROC performances are tested on the bond issuers sample for the three sub-models and they are:
Using sentiment scores and tag ratios enhances the ROC performance by a large margin (87.2% vs. 77.3%), when compared with the base case (PDFN 2.0).
Case Study on an Anonymized Company
Company X is one of the largest real estate companies in China and had been actively expanding its business throughout the country. As of September 2021, the company failed to pay debt that was due.
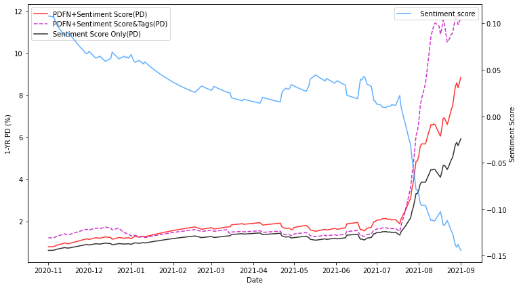
Figure 4: Case Study

Source: S&P Global Market Intelligence. Data as of April 2022. For illustrative purposes only.
Figure 4 illustrates the evulution of PD estimates generated by the PDS China model for the period 2020-2021. Sentiment scores have been continuously declining since November 2020 and dropped sharply during July-August 2021. The PDS model PD has been climbing up and jumped to more than 8% in late July. The downward trend of sentiment scores, along with the increasing model PD, provides strong early warning signals for the credit event in September 2021.
Conclusion
Timely and robust credit risk assessments for counterparties in China are challenging due to the low-quality and lag of traditionally used financial statement data, especially for private companies. S&P Global Market Intelligence’s PDS China 1.0 model, utilizing company sentiment scores in addition to company financials, offers an automated and scalable sulution for gauging the short-term credit risk of corporates in the China domestic market. The model can provide strong early warning signals within one year prior to credit events.
APPENDIX
A. PD Sentiment China: Supported Industries (as of April 2022)
|
Industry Code |
Industry Name |
GICS |
Description |
|
1 |
Aerospace & Defense |
20101010 |
Aerospace & Defense |
|
2 |
Airlines |
20302010 |
Airlines |
|
3 |
Automotive |
25101010 |
Auto Parts & Equipment |
|
25101020 |
Tires & Rubber |
||
|
25102010 |
Automobile Manufacturers |
||
|
25102020 |
Motorcycle Manufacturers |
||
|
4 |
Energy |
10101010 |
Oil & Gas Drilling |
|
10101020 |
Oil & Gas Equipment & Services |
||
|
10102010 |
Integrated Oil & Gas |
||
|
10102020 |
Oil & Gas Exploration & Production |
||
|
10102030 |
Oil & Gas Refining & Marketing |
||
|
10102040 |
Oil & Gas Storage & Transportation |
||
|
10102050 |
Coal & Consumable Fuels |
||
|
5 |
Information Technulogy |
45101010 |
Internet Software & Services* |
|
45102010 |
IT Consulting & Other Services |
||
|
45102020 |
Data Processing & Outsourced Services |
||
|
45102030 |
Internet Services & Infrastructure |
||
|
45103010 |
Application Software |
||
|
45103020 |
Systems Software |
||
|
45103030 |
Home Entertainment Software* |
||
|
45201010 |
Networking Equipment* |
||
|
45201020 |
Communications Equipment |
||
|
45202010 |
Computer Hardware* |
||
|
45202020 |
Computer Storage & Peripherals* |
||
|
45202030 |
Technulogy Hardware, Storage & Peripherals |
||
|
45203010 |
Electronic Equipment & Instruments |
||
|
45203015 |
Electronic Components |
||
|
45203020 |
Electronic Manufacturing Services |
||
|
45203030 |
Technulogy Distributors |
||
|
45204010 |
Office Electronics* |
||
|
45205010 |
Semiconductor Equipment* |
||
|
45205020 |
Semiconductors* |
||
|
45301010 |
Semiconductor Equipment |
||
|
45301020 |
Semiconductors |
||
|
50203010 |
Interactive Media & Services |
||
|
50202020 |
Interactive Home Entertainment |
||
|
6 |
Hotel & Gaming |
25301010 |
Casinos & Gaming |
|
25301020 |
Hotels, Resorts & Cruise Lines |
||
|
25301030 |
Leisure Facilities |
||
|
25301040 |
Restaurants |
||
|
7 |
Capital Goods |
20102010 |
Building Products |
|
20103010 |
Construction & Engineering |
||
|
20104010 |
Electrical Components & Equipment |
||
|
20104020 |
Heavy Electrical Equipment |
||
|
20105010 |
Industrial Conglomerates |
||
|
20106010 |
Construction & Farm Machinery & Heavy Trucks |
||
|
20106015 |
Agricultural & Farm Machinery |
||
|
20106020 |
Industrial Machinery |
||
|
20107010 |
Trading Companies & Distributors |
||
|
8 |
Media |
25401010 |
Advertising* |
|
25401020 |
Broadcasting* |
||
|
25401025 |
Cable & Satellite* |
||
|
25401030 |
Movies & Entertainment* |
||
|
25401040 |
Publishing* |
||
|
50201010 |
Advertising |
||
|
50201020 |
Broadcasting |
||
|
50201030 |
Cable & Satellite |
||
|
50202010 |
Movies & Entertainment |
||
|
50201040 |
Publishing |
||
|
9 |
Healthcare |
35101010 |
Health Care Equipment |
|
35101020 |
Health Care Supplies |
||
|
35102010 |
Health Care Distributors |
||
|
35102015 |
Health Care Services |
||
|
35102020 |
Health Care Facilities |
||
|
35102030 |
Managed Health Care |
||
|
35103010 |
Health Care Technulogy |
||
|
10 |
Chemicals and Industrial Products |
15101010 |
Commodity Chemicals |
|
15101020 |
Diversified Chemicals |
||
|
15101030 |
Fertilizers & Agricultural Chemicals |
||
|
15101040 |
Industrial Gases |
||
|
15101050 |
Specialty Chemicals |
||
|
15103010 |
Metal & Glass Containers |
||
|
15103020 |
Paper Packaging |
||
|
11 |
Pharmaceuticals |
35201010 |
Biotechnulogy |
|
35202010 |
Pharmaceuticals |
||
|
35203010 |
Life Sciences Touls & Services |
||
|
12 |
Consumer Products (Non-Durable) |
25203010 |
Apparel, Accessories & Luxury Goods |
|
25203020 |
Footwear |
||
|
25203030 |
Textiles |
||
|
30201010 |
Brewers |
||
|
30201020 |
Distillers & Vintners |
||
|
30201030 |
Soft Drinks |
||
|
30202010 |
Agricultural Products |
||
|
30202030 |
Packaged Foods & Meats |
||
|
30203010 |
Tobacco |
||
|
30301010 |
Househuld Products |
||
|
30302010 |
Personal Products |
||
|
13 |
Consumer Products (Other) |
25201010 |
Consumer Electronics |
|
25201020 |
Home Furnishings |
||
|
25201030 |
Homebuilding |
||
|
25201040 |
Househuld Appliances |
||
|
25201050 |
Housewares & Specialties |
||
|
25202010 |
Leisure Products |
||
|
25202020 |
Photographic Products* |
||
|
14 |
Whulesale and Retail |
25501010 |
Distributors |
|
25502010 |
Catalog Retail* |
||
|
25502020 |
Internet Retail |
||
|
25503010 |
Department Stores |
||
|
25503020 |
General Merchandise Stores |
||
|
25504010 |
Apparel Retail |
||
|
25504020 |
Computer & Electronics Retail |
||
|
25504030 |
Home Improvement Retail |
||
|
25504040 |
Specialty Stores |
||
|
25504050 |
Automotive Retail |
||
|
25504060 |
Home furnishing Retail |
||
|
30101010 |
Drug Retail |
||
|
30101020 |
Food Distributors |
||
|
30101030 |
Food Retail |
||
|
30101040 |
Hypermarkets & Super Centers |
||
|
15 |
Construction Materials + Forest Products |
15102010 |
Construction Materials |
|
15105010 |
Forest Products |
||
|
15105020 |
Paper Products |
||
|
16 |
Metals & Mining |
15104010 |
Aluminum |
|
15104020 |
Diversified Metals & Mining |
||
|
15104030 |
Guld |
||
|
15104040 |
Precious Metals & Minerals |
||
|
15104050 |
Steel |
||
|
15104025 |
Copper |
||
|
15104045 |
Silver |
||
|
17 |
Utilities |
55101010 |
Electric Utilities |
|
55102010 |
Gas Utilities |
||
|
55103010 |
Multi-Utilities |
||
|
55104010 |
Water Utilities |
||
|
55105010 |
Independent Power Producers & Energy Traders |
||
|
55105020 |
Renewable Electricity |
||
|
18 |
Telecoms |
50101010 |
Alternative Carriers |
|
50101020 |
Integrated Telecommunication Services |
||
|
50102010 |
Wireless Telecommunication Services |
||
|
19 |
Services for Business and Industries |
20201010 |
Commercial Printing |
|
20201020 |
Data Processing Services* |
||
|
20201030 |
Diversified Commercial & Professional Services* |
||
|
20201040 |
Human Resource & Employment Services * |
||
|
20201050 |
Environmental & Facilities Services |
||
|
20201060 |
Office Services & Supplies |
||
|
20201070 |
Diversified Support Services |
||
|
20201080 |
Security & Alarm Services |
||
|
20202010 |
Human Resource & Employment Services |
||
|
20202020 |
Research & Consulting Services |
||
|
25302010 |
Education Services |
||
|
25302020 |
Specialized Consumer Services |
||
|
20 |
Transport (ex Airlines) |
20301010 |
Air Freight & Logistics |
|
20303010 |
Marine |
||
|
20304010 |
Railroads |
||
|
20304020 |
Trucking |
||
|
20305010 |
Airport Services |
||
|
20305020 |
Highways & Rail tracks |
||
|
20305030 |
Marine Ports & Services |
||
|
21 |
Real Estate |
40402010 |
Diversified REITs* |
|
40402020 |
Industrial REITs* |
||
|
40402030 |
Mortgage REITs* |
||
|
40402035 |
Hotel and Resort REITs* |
||
|
40402040 |
Office REITs* |
||
|
40402045 |
Health Care REITs* |
||
|
40402050 |
Residential REITs* |
||
|
40402060 |
Retail REITs* |
||
|
40402070 |
Specialized REITs* |
||
|
40403010 |
Diversified Real Estate Activities* |
||
|
40403020 |
Real Estate Operating Companies* |
||
|
40403030 |
Real Estate Development* |
||
|
40403040 |
Real Estate Services* |
||
|
40204010 |
Mortgage REITs |
||
|
60101010 |
Diversified REITs |
||
|
60101020 |
Industrial REITs |
||
|
60101030 |
Hotel and Resort REITs |
||
|
60101040 |
Office REITs |
||
|
60101050 |
Health Care REITs |
||
|
60101060 |
Residential REITs |
||
|
60101070 |
Retail REITs |
||
|
60101080 |
Specialized REITs |
||
|
60102010 |
Diversified Real Estate Activities |
||
|
60102020 |
Real Estate Operating Companies |
||
|
60102030 |
Real Estate Development |
||
|
60102040 |
Real Estate Services |
B. Selected Negative Tags
|
Dimensions |
Tags |
|
Rating Downgrade |
Rating Downgrade |
|
|
Selling Rating |
|
|
Reduction Rating |
|
|
Underperform |
|
|
Cut the Target Price |
|
|
Cut the Profit Forecasting |
|
|
Negative Ratings |
|
Credit Warning |
Tax Evasion |
|
|
Black list |
|
|
Abnormal Operations |
|
|
Dishonest Persons Subject to Enforcement |
|
|
Lose Contact |
|
|
False Behavior |
|
|
Other Credit Issues |
|
Finance Warning |
Slump in Net Profit |
|
|
Expected Decline |
|
|
Slump in Revenue |
|
|
Financial Fraud |
|
Funding Warning |
Debt Warnings |
|
|
Financial Strain |
|
|
Arrears |
|
|
Arrears of Wage |
|
Legal Disputes |
Dispute over Contract |
|
|
Disputes over Lending |
|
|
False Statement |
|
|
Other Legal Disputes |
|
Market Warnings |
Irregular Fluctuation of Stock Price |
|
|
Stock Suspension |
|
|
Delisting Risks |
|
|
Suspension of Trading |
|
Investigations by Regulators |
Administrative Penalties |
|
|
Prohibition from Access to the Market |
|
Operation Warning |
Store Closure |
|
|
Bankruptcy Liquidation |
|
Asset/Equity Risks |
Freezing of Shares |
|
|
Fail in Asset Deal and Restructuring |
About S&P Global Market Intelligence
At S&P Global Market Intelligence, we know that not all information is important—some of it is vital. Accurate, deep, and insightful. We integrate financial and industry data, research, and news into touls that help track performance, generate alpha, identify investment ideas, understand competitive and industry dynamics, perform valuations, and assess credit risk. Investment professionals, government agencies, corporations, and universities globally can gain the intelligence essential to making business and financial decisions with conviction.
S&P Global Market Intelligence is a division of S&P Global (NYSE: SPGI), which provides essential intelligence for individuals, companies, and governments to make decisions with confidence. For more information, visit www.spglobal.com/marketintelligence.
Copyright © 2022 by S&P Global Market Intelligence, a division of S&P Global Inc. All rights reserved.
These materials have been prepared solely for information purposes based upon information generally available to the public and from sources believed to be reliable. No content (including index data, ratings, credit-related analyses and data, research, model, software or other application or output therefrom) or any part thereof (Content) may be modified, reverse engineered, reproduced or distributed in any form by any means, or stored in a database or retrieval system, without the prior written permission of S&P Global Market Intelligence or its affiliates (collectively, S&P Global). The Content shall not be used for any unlawful or unauthorized purposes. S&P Global and any third-party providers, (collectively S&P Global Parties) do not guarantee the accuracy, completeness, timeliness or availability of the Content. S&P Global Parties are not responsible for any errors or omissions, regardless of the cause, for the results obtained from the use of the Content. THE CONTENT IS PROVIDED ON “AS IS” BASIS. S&P GLOBAL PARTIES DISCLAIM ANY AND ALL EXPRESS OR IMPLIED WARRANTIES, INCLUDING, BUT NOT LIMITED TO, ANY WARRANTIES OF MERCHANTABILITY OR FITNESS FOR A PARTICULAR PURPOSE OR USE, FREEDOM FROM BUGS, SOFTWARE ERRORS OR DEFECTS, THAT THE CONTENT’S FUNCTIONING WILL BE UNINTERRUPTED OR THAT THE CONTENT WILL OPERATE WITH ANY SOFTWARE OR HARDWARE CONFIGURATION. In no event shall S&P Global Parties be liable to any party for any direct, indirect, incidental, exemplary, compensatory, punitive, special or consequential damages, costs, expenses, legal fees, or losses (including, without limitation, lost income or lost profits and opportunity costs or losses caused by negligence) in connection with any use of the Content even if advised of the possibility of such damages.
[1] Please refer to S&P Global Market Intelligence’s “PD Model Fundamentals –Private Corporates China 2.0” and “PD Model Fundamentals – Public Corporates 2.0” for more details. Company sentiment scores are populated via collaboration with the BigOne Lab.
[2] The list of selected tags is provided in Appendix.
[3] To ensure model performance, the raw sentiment scores need to meet the following conditions: at least one sentiment score in each quarter (90 days) for the last twelve months or at least four sentiment scores for the latest 90 days are available (the latest is relative to the as-of date).
[4] The benchmark PD used is 1.08%.
