


Research — 4 Jul, 2024
Depositories banking on rate cuts, but growing number marketing high-rate CDs

By Thomas Mason
Even though interest rates appear to have peaked, many depositories continue to use 1-year certificates of deposit with relatively high rates to attract and retain customers.

The rates on high-yield savings accounts have attracted attention from the press and consumers alike, and for good reason: Data shows that a fair portion of the annual percentage yields offered by banks and credit unions are far above the norm. But those institutions tend to be extreme outliers. A better bellwether of where depositories are competing heavily is deposit betas and, by that measure, 1-year CDs and premium money market accounts are the key focal points. A comparison of CD maturities shows that banks and credit unions are betting on the Federal Reserve lowering rates — and have been for over a year — by leading with higher rates on 1-year CDs versus longer-term products.

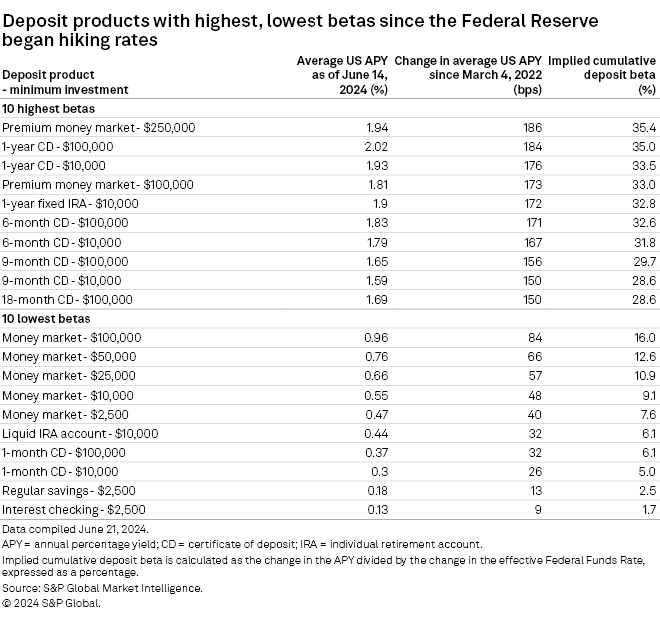
Sharp increases in interest rates and regulators' focus on bank liquidity have put a premium on all deposits, but some deposit products have proven far more rate-sensitive than others through the Fed's tightening cycle. One-year CDs were among the products with the highest implied cumulative deposit betas since the Fed started hiking interest rates in March 2022. The national average APY on a 1-year CD with a $100,000 investment minimum rose 184 basis points since March 4, 2022, implying that 35% of the 525-basis-point increase in the effective Fed Funds rate flowed through to the APY. Premium money market accounts with large investment minimums were also in the top five, along with a 1-year fixed individual retirement account.
The Workbench notebook accompanying this article automates the process of calculating deposit betas, along with many other calculations in this analysis, and can be easily updated for future periods. It pulls S&P Global Market Intelligence's depository rates and economic data — which are located in different databases — into one location and provides downloadable visualizations of the data.

In terms of maturity, banks and credit unions have tended to raise rates faster on shorter-term products, particularly in the 6- to 12-month time horizon. The lone exception was the 1-month CD; the APY on one with a $100,000 minimum, for instance, has only ticked up by 32 basis points since the Fed started hiking rates.
Industry data shows how banks are using CDs to bolster their deposit funding as well. For the commercial banking industry, the ratio of CDs-to-total deposits rose to 15.5% in the first quarter of 2024 from 15.3% in the fourth quarter of 2023 and 14.5% in the third quarter of 2023. Further, the percentage of CDs repricing in one year, relative to the commercial banking industry's total deposits, continued to climb in the first quarter of 2024, rising to 13.2% from 12.9% sequentially, providing further indication that banks are concentrating their deposit bases in shorter-term CD products.
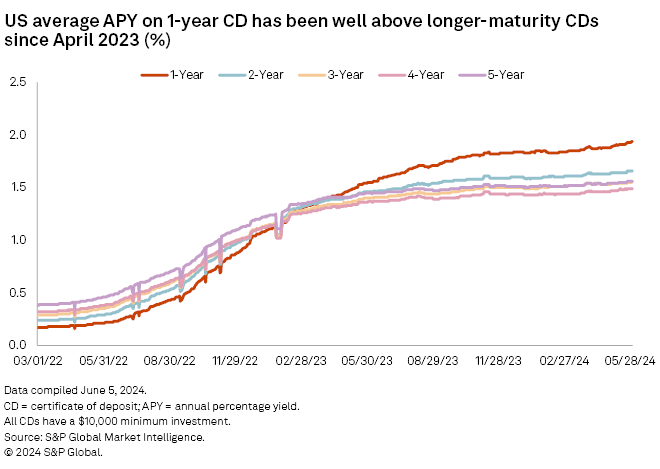
One of the most stark discrepancies between short-term products and long-term products is the rate on 1-year CDs relative to longer-term CDs. In mid-February 2023, the 1-year CD rate eclipsed the 3-year rate, and in early April of that year it started trading above the 5-year rate. The fact that 1-year CD rates are higher than the other, longer-term rates suggests that banks and credit unions anticipate interest rates will be lower in the next 12 months, which aligns with the futures market. According to the CME's FedWatch tool as of June 26, the market predicts only an 10.3% chance of the Fed lowering its target rate by 25 basis points at the July 31 meeting. But that probability climbs to 56.3% for the Sept. 18 meeting.
Our analysis includes both credit unions and banks, as it is no secret that credit unions tend to offer higher rates than banks. The median and average APYs offered by credit unions were higher across nearly all products as of June 14. The divide between banks and credit unions can even be seen at very high APY levels. Approximately 42% of credit unions were offering 1-year CDs with an APY above 4% — an APY that is roughly double the national average — whereas only 23% of banks were, based on institutions for which rates were available. Those credit unions accounted for 53% of the deposits of all credit unions in the US, versus only 15% for banks.
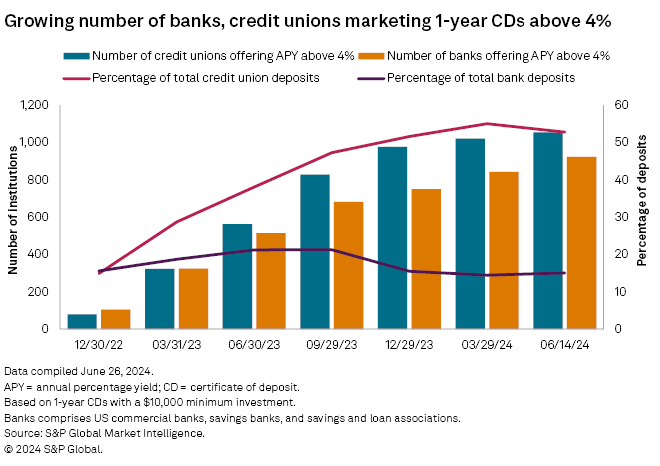
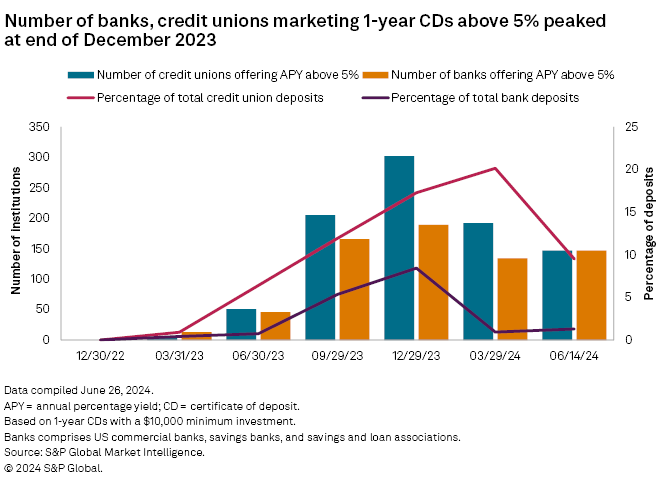
The number of credit unions and banks offering APYs above 4% continued to climb from the end of March 2024 to the middle of June, suggesting that depositories are increasingly willing to pay higher rates. But when one raises the threshold to 5%, it paints a different picture. The highest rate payers seem to be pulling back somewhat. The trend of more institutions offering upward of 5% reversed in the fourth quarter of 2023, which was the same point at which credit union and banking industry deposits began to grow again, following several quarters of declines. A reduced need for funding is an important factor in institutions' decisions to rein in rates.
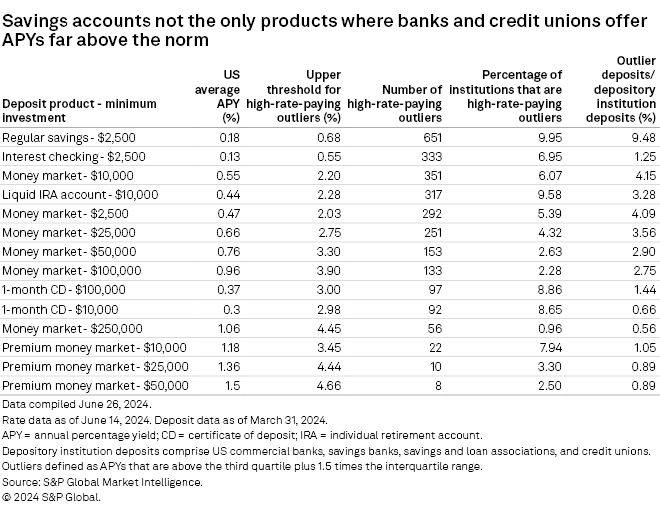
While most depositories have relied heavily on CDs for funding, savings accounts are notable for the number of banks and credit unions that offer rates way above the norm. The median APY on a regular savings account with a $2,500 minimum investment was only 0.18% as of June 14, whereas 651 institutions were offering APYs of 0.68% or more — the upper threshold for outliers, as explained in the "About the analysis" section below. By contrast, all the APYs on the 1-year CD were within the normal range.
Savings accounts are also particularly interesting because a handful of the banks offering the highest rates are relatively large institutions. Five banks with over $100 billion in deposits — Goldman Sachs Bank USA, Capital One NA, Ally Bank, American Express National Bank, and Discover Bank — were all offering APYs above 4% as of June 14, far exceeding the upper outlier threshold. Digital banks such as these have no branch footprint and can pass along those savings to customers in the form of higher rates. As such, we would expect them to be among the outliers. But, in general, they are relatively unique institutions in the overall banking landscape. We view 1-year CDs and premium money market accounts as the areas where the industry as a whole are competing the most aggressively on rates.
About the analysis
Deposit betas are a key gauge of products' rate sensitivity, as they measure the basis-point increase in the national average annual percentage yield for a given product relative to the basis point increase in the effective Federal Funds rate during the same time frame; in essence, they measure how much rate the institutions has passed along to the customer.
The outlier thresholds were calculated using an interquartile range analysis, which involves calculating the first and third quartiles, then the difference between the two quartiles (which is the interquartile range). Quartiles split the data — in this case, all the APYs offered by institutions on a given deposit product — into four equal parts. The first quartile represents the value below which 25% of the data falls, while the second quartile represents the median and the third quartile represents the value below which 75% of the data falls. Per the traditional IQR outlier equation, if a value is above the third quartile plus 1.5 times the interquartile range, then it is considered an outlier on the high side (often referred to as an upper fence). If a value is below the first quartile minus 1.5 times the interquartile range, it is considered an outlier on the low side (lower fence). But for our analysis, we were interested only in products where banks were marketing very high rates relative to peers. Therefore, we modified the traditional equation to only look for outliers on the high side.
Access the US bank rates starter guide on Workbench to begin your analysis or request a demo here. Please direct your questions to Tom Mason, Senior Research Analyst, S&P Global Market Intelligence FIG Research at thomas.mason@spglobal.com.
This article was published by S&P Global Market Intelligence and not by S&P Global Ratings, which is a separately managed division of S&P Global.