S&P Global Offerings
Featured Topics
Featured Products
Events
S&P Global Offerings
Featured Topics
Featured Products
Events
S&P Global Offerings
Featured Topics
Featured Products
Events
Banking & Capital Markets
Economy & Finance
Energy Transition & Sustainability
Technology & Innovation
Podcasts & Newsletters
Banking & Capital Markets
Economy & Finance
Energy Transition & Sustainability
Technology & Innovation
Podcasts & Newsletters
S&P Global Offerings
Featured Topics
Featured Products
Events
Research — 25 Jan, 2024
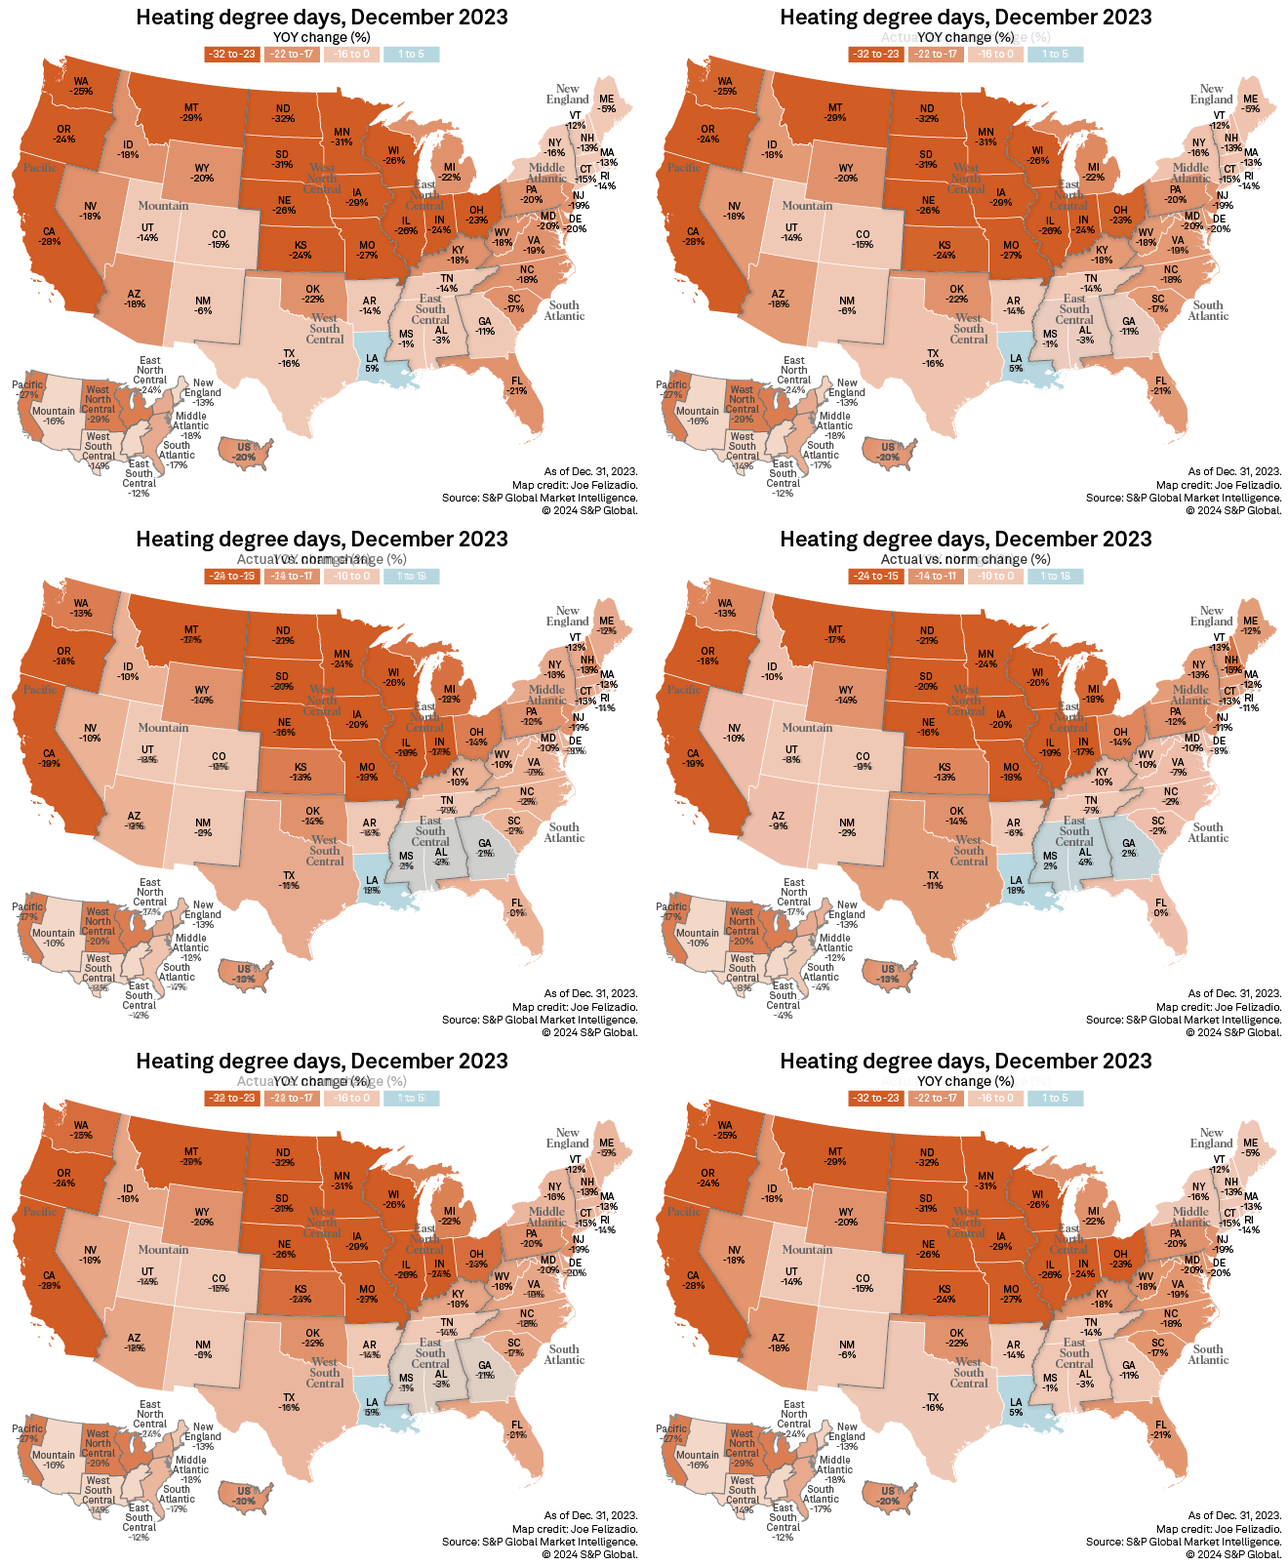
Meteorological winter began on an unusually mild note, with the US experiencing its warmest December in a 129-year period. Record-high temperatures were observed in several states across the West and the High Plains, while precipitation levels were higher than average for much of the contiguous US. Nationwide heating degree days were down substantially for both the month and quarter ended Dec. 31, 2023, compared with year-ago levels and historical norms.

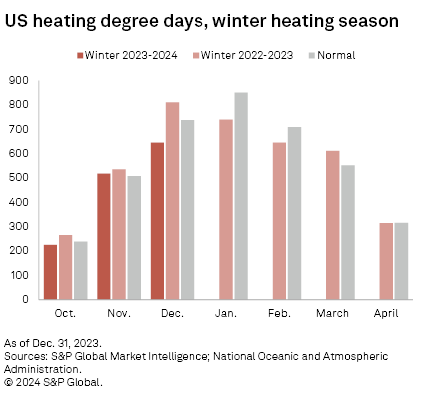
Temperatures were well above average for most of the US in December 2023, keeping heating demand weak for the third month in a row. Heating degree days (HDDs) have not exceeded year-ago levels since the winter heating season started in October 2023. The monthly total declined 20% year over year, while the quarterly total fell 13%. The country is still under El Niño conditions, but the National Oceanic and Atmospheric Administration (NOAA) expects a transition to El Niño-Southern Oscillation (ENSO)-neutral sometime during April–June 2024, raising the odds to 73% from about 60% in November 2023.


Degree day data reflected the unseasonably warm December, with all regions showing notably fewer HDDs than in the previous year and versus the December norm. The decline was most pronounced across the West North Central and East North Central areas, where several states recorded their warmest December in over a century, according to NOAA data. These states include North Dakota, South Dakota, Nebraska, Minnesota, Iowa and Wisconsin, which collectively had 26%-32% fewer HDDs on a year-over-year basis and 16%-24% fewer heating days compared with the monthly average. A blizzard late in the month brought heavy snow and powerful winds across the High Plains, but it could not prevent record warmth in the region. HDDs similarly fell 29% year over year in Montana, where record-high temperatures were also reported.
Heating degree days for December 2023 were higher than the norm only in parts of the Lower Mississippi Valley and the Southeast, where near-average temperatures dominated. Georgia and Mississippi each had 2% more HDDs than average, while Alabama saw a 4% increase. Additionally, heating days in Louisiana were 18% higher than the December norm and rose 5% year over year.
Amid weaker heating demand from nearly all states, nationwide HDDs fell 20% from a year ago and were 13% lower than the monthly norm.

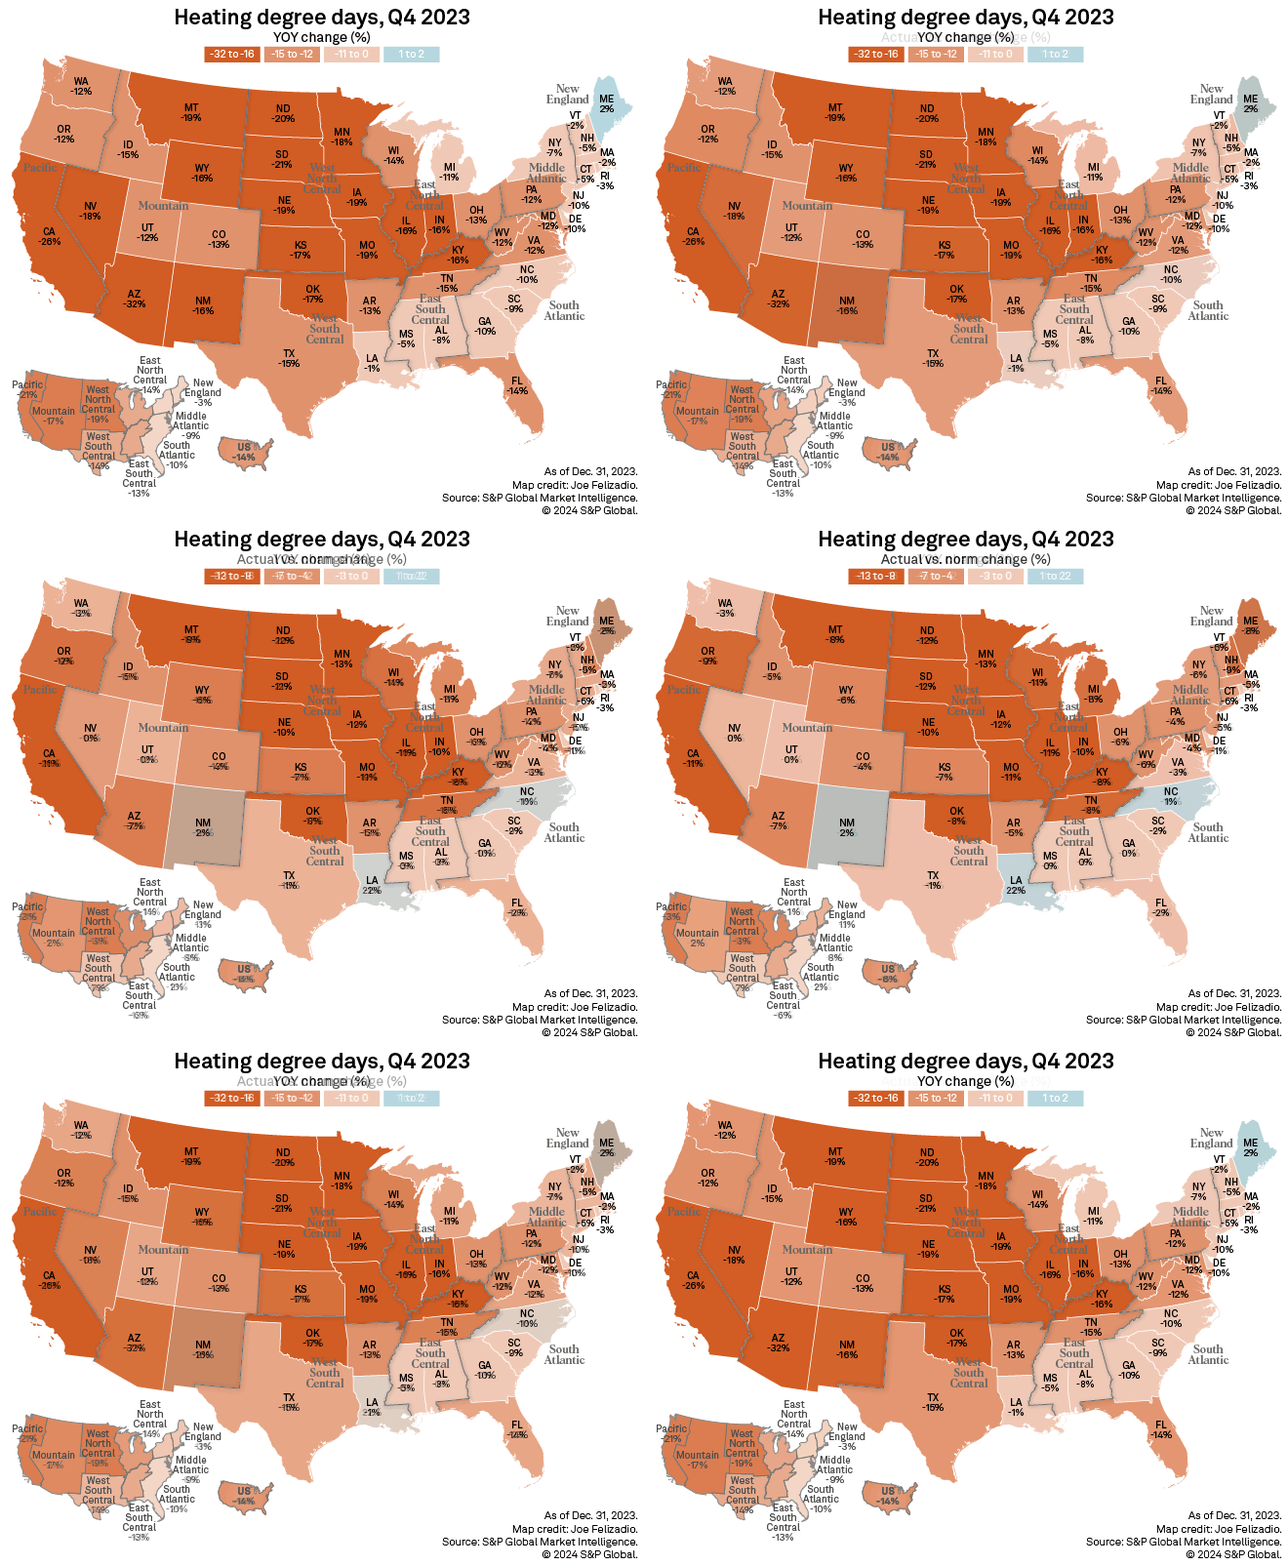
Fourth-quarter data shows a similar pattern as persistent heat resulted in a remarkably mild fall and early winter. HDDs declined 14% year over year and by 6% versus the average during the three-month period. Maine was the only state that showed year-over-year growth, up 2% from the fourth quarter of 2022, while Louisiana had 22% more HDDs than the historical norm.

Loads and markets

|
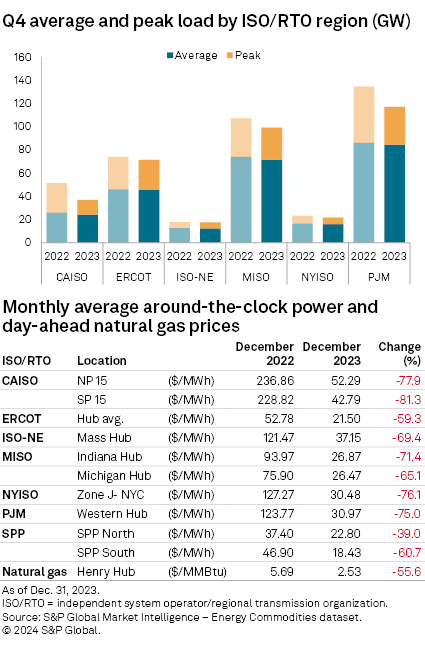
Average loads for the fourth quarter were down year over year across all regional transmission organizations/independent system operators (RTOs/ISOs) along with average power prices for December. California ISO saw the biggest drop at 7.0% to 24.2 GW, while average prices plunged 81.3% to $42.79/MWh at SP 15. Midcontinent ISO followed with a 3.1% decline in average load, down to 71.7 GW, while average real-time prices similarly plummeted 71.4% to $26.87/MWh at Indiana Hub and 65.1% to $26.47/MWh at Michigan Hub. Average load at New York ISO was 1.9% lower than in the fourth quarter of 2022, and prices declined 76.1% to $30.48/MWh at the operator's Zone J.
The PJM Interconnection LLC, ISO New England and Electric Reliability Council of Texas Inc. complete the list with declines of 1.7%, 1.3% and 1.0% in average loads, respectively, and price decreases ranging from 59.3% at the ERCOT Hub, 69.4% at ISO-NE's Mass. Hub and 75.0% at PJM's Western Hub. The day-ahead natural gas price at the Henry Hub was $2.53/MMBtu, 55.6% lower than the December 2022 total.
Peak loads were likewise down during the quarter, with notable regional variations. Peak load at CAISO shrunk 50.3% to 12.6 GW from about 26.0 GW, and it fell 33.1% at PJM to 32.5 GW from 48.6 GW. NYISO and MISO posted respective declines of 17.6% and 16.8%. At ERCOT, peak load dropped 7.0% year over year, and at ISO-NE, it dipped 0.3% to 5.16 GW from 5.18 GW.
Earlier in the month, the US Energy Information Administration lowered its Henry Hub average spot price forecast to about $2.80/MMBtu for the northern hemisphere winter (November–March), a reduction of more than 60 cents from the guidance it issued in November. The agency said the change reflects high natural gas production coupled with a warmer-than-average start to the winter season, which has weakened demand for space heating in the country.
The most recent data from the US Bureau of Labor Statistics shows that electricity prices increased 3.3% over the last 12 months and by 1.3% in December after rising 1.4% in the prior month. In contrast, natural gas prices declined 0.4% over the month and by 13.8% over the past year.
ENSO update: Closer to change
According to ENSO reports issued Jan. 11, the current weather pattern is expected to continue through the Northern Hemisphere winter, with ENSO-neutral conditions favored during April–June 2024. Equatorial sea surface temperatures were above average across much of the Pacific Ocean in December, with the largest differences observed in the central and east-central Pacific. The tropical Pacific atmospheric pattern reflected a strong and mature El Niño, but the NOAA expects it to weaken gradually during spring 2024 and transition to ENSO-neutral, with a 73% probability.
January outlook: Cooler winter in Southwest, Great Plains
The weather outlook for January shows considerable temperature variations and above-average precipitation across much of the contiguous US, according to the forecast issued Dec. 30, 2023, by the NOAA. Winter temperatures are expected to be well above normal in parts of the Northwest and throughout the northern portions of the Northeast, and below average from the Southwest to the northern Plains. The highest odds for a warmer-than-average start to the year are in New England, where probabilities exceed 50%. Precipitation is also favored to be well above average for most of the country, with the exception of the northern Plains, Ohio Valley and western and southern Texas, where weather forecasters see equal chances for above-, near- or below-average precipitation.
A cooling degree day is created for each degree where the mean daily temperature exceeds 65 degrees F, and a heating degree day similarly reflects below-65-degree temperatures. The data included in this report is based on population-weighted data collected by the NOAA/US Commerce Department. The "normal" data is computed by S&P Global Commodity Insights to be a 15-year average updated each month. We believe that this 15-year normal is more representative of current weather trends and will reflect recent climate changes.
Regulatory Research Associates is a group within S&P Global Commodity Insights.
S&P Global Commodity Insights produces content for distribution on S&P Capital IQ Pro.
For a complete, searchable listing of RRA's in-depth research and analysis, please go to the S&P Capital IQ Pro Energy Research Library.
Joe Felizadio contributed to this article.
This article was published by S&P Global Market Intelligence and not by S&P Global Ratings, which is a separately managed division of S&P Global.
